Perforce JViews Gantt sample gallery
How to run the samples is explained in the starting the samples page.
Basic Samples
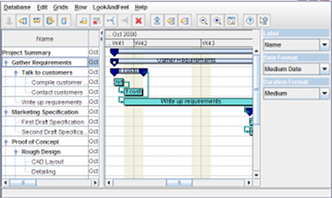
Gantt Viewer
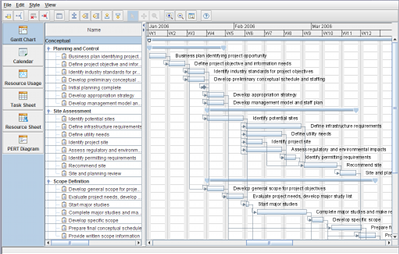
This sample presents a Gantt project viewer developed with JViews Gantt and JViews Diagrammer components.
Gallery: Loading Designer Projects
This sample shows a gallery of different Gantt and Schedule chart projects.
Extending a Designer Project
This sample shows how to use the Gantt SDK to extend a project built with the Designer. It adds interactors.
Activity Chart (SDK)
This sample shows a simple project scheduling application displayed as an activity-oriented Gantt Chart.
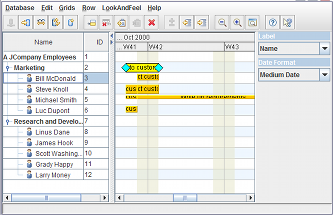
Resource Chart (SDK)
This sample shows a simple project scheduling application displayed as a resource-oriented Schedule Chart.
Printing Gantt Charts
This sample contains a simple project showing how to print a Gantt or Schedule chart on multiple pages.
Printing Load Charts
This sample demonstrates the printing capability of the Resource Data Chart component, showing how to print the Chart on multiple pages.
Data Computations
Filtering Activities
This sample illustrates how to create a Gantt data model that filters activities using a regular expression.
Sorting Activities
This sample illustrates how to create a sortable Gantt data model.
Searching Activities
This sample shows how to search activities displayed in a Gantt chart by applying a regular expression to the activity names.
Computing Critical Path
This sample demonstrates the critical path computation capabilities of the Gantt chart component. Activities that have a total slack time of zero are considered to be on the critical path.
Customizing Rendering
Custom Rendering Effects
This sample shows how to customize activity rendering using the advanced graphics features of the Java2 API.
Activity Chart Rendering (CSS)
This sample demonstrates the styling capability for the Gantt chart component using Cascading Style Sheets (CSS).
Resource Chart Rendering (CSS)
This sample demonstrates the styling capability for the Schedule chart component using Cascading Style Sheets (CSS).
Load Chart Rendering (CSS)
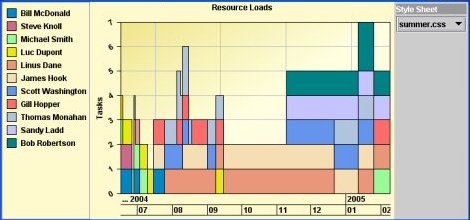
This sample demonstrates the styling capability for the Resource data chart component using Cascading Style Sheets (CSS).
Rendering a Custom Data Model
This sample shows a project scheduling application that displays application-specific data. It shows an activity-oriented Gantt Chart that has been customized using the SDK to render and edit user-defined activity properties. The sample also shows customized rendering of constraint links and table columns.
Vacation Activity
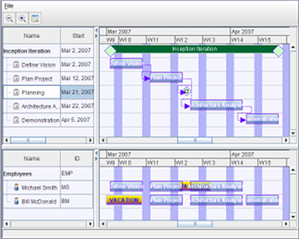
This sample presents a simple data viewer that demonstrates the use of basic JViews Gantt concepts, as well as user-defined activities. It shows the vacation of the personnel as an activity. It shows this data by an activity-oriented Gantt chart synchronized with a resource-oriented Gantt chart. The sample also demonstrates model filtering and user-defined z-ordering of activities.
Relative Time Scale
This sample demonstrates the capability of the Time Scale component by customizing the time scale rows. The time scale rows are numbered relative to a reference date.
Nonlinear Time Scale
This sample shows how to create a non-linear time converter that displays days in the weekend using a smaller column width than days in the working week.
Multiple Views
Activity and Resource Charts
This sample shows how to coordinate the display of an activity-oriented Gantt chart and a resource-oriented Schedule chart when both charts are bound to the same Gantt data model.
Resource and Load Charts
This sample shows how to use an IlvResourceDataChart
to display the load for resources selected in an
IlvScheduleChart.
Activity Chart and Calendar
This sample demonstrates the monthly and daily calendar view Gantt components.
Accessibility
This sample shows how to enable and utilize various accessibility features, such as keyboard navigation, with a Gantt and Schedule Chart.
Additional Data Table
This sample shows how to coordinate an additional table of data with a Gantt Chart.
Connecting to Data
Activity Chart and XML
JViews Gantt provides the ilog.views.gantt.xml package.
It is designed to serialize scheduling data contained in Gantt models into
SDXL (Schedule Data eXchange Language) files. This sample shows how to use
this package to serialize Gantt models associated with a Gantt Chart into
SDXL files.
Resource Chart and XML
JViews Gantt provides the ilog.views.gantt.xml package.
It is designed to serialize scheduling data contained in Gantt models into
SDXL (Schedule Data eXchange Language) files. This sample shows how to use
this package to serialize Gantt models associated with a Schedule Chart into
SDXL files.
Activity Chart and JDBC
This sample shows how to use the
ilog.views.model.table.IlvTableGanttModel
class to connect an activity-oriented Gantt chart to a JDBC-enabled database
in read/write mode.
Resource Chart and JDBC
This sample shows how to use the
ilog.views.model.table.IlvTableGanttModel
class to connect a resource-oriented Schedule chart to a JDBC-enabled
database in read/write mode.
Custom Activity Chart Connection
This sample shows how to create a custom data model implementation that effeciently connects an activity-oriented Gantt chart to a custom data source. The custom data model implements load-on-demand.
Custom Resource Chart Connection
This sample shows how to create a custom data model implementation that effeciently connects a resource-oriented Schedule chart to a custom data source. The custom data model implements load-on-demand.
Performance
Benchmarking Gantt Charts
This sample shows the performance of the Gantt and Schedule charts.
Web Deployment with JavaServer Faces
Gantt Chart Editing (JSF and JavaScript)
This sample shows how to display and interact with a Gantt chart using Perforce JViews Gantt JavaServer Faces components.
Gantt Chart Viewer (JSF and JavaScript)
This sample shows how to display and interact on a Gantt chart using Perforce JViews Gantt JavaServer Faces components.
Other Web Deployment
Gantt Chart (Servlets and JavaScript)
This sample illustrates how to use the thin-client capabilities of the JViews Gantt Chart module to deploy light Dynamic HTML (DHTML) user interfaces for a web browser. Using this configuration, most of the Gantt functionality resides as a servlet on the server. A set of lightweight, cross-browser JavaScript files is provided to allow you to easily construct a Gantt user interface on the browser. The interface is used to connect to the servlet. This allows you to display and interact with the Gantt chart images created by the server in your browser.