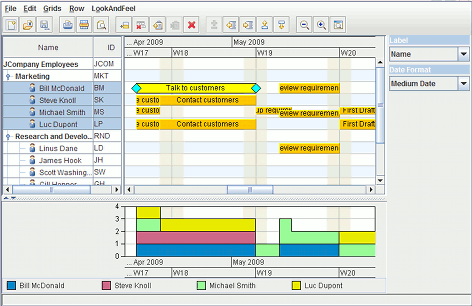
Perforce JViews Gantt Sample: Resource and Load Charts
Description
 |
This sample shows how to use an IlvResourceDataChart
to display the load for resources selected in an
IlvScheduleChart.
How to Use the Sample
-
At the top of the sample window, an
IlvScheduleChartobject shows the resources and reservations. Select a resource in the Name column and see the load for the selected resource at the bottom of the user interface. The resource load changes when you drag or delete a reservation for a resource or resources. You can make multiple selections by dragging the mouse over the table or by Ctrl/Shift-clicking resources. -
At the bottom of the sample window, an
IlvResourceDataChartobject displays the load for the selected resource. For a given time interval, the load of the resource is calculated by counting the number of concurrent activities that have reserved the resource. The vertical scale of theIlvResourceDataChartobject indicates the number of concurrent activities. When only one resource is selected, theIlvResourceDataChartobject displays the load for that resource. When multiple resources are selected, theIlvResourceDataChartobject displays the cumulative load of the selected resources. The cumulative load is obtained by adding the load of each selected resource. The cumulative load is shown in a stacked manner so that you can distinguish the contribution of each individual resource by the color assigned to it.
How to Run the Sample as an Application
This sample can
be run as an application.
The installation directory contains
an executable JAR file,
resource-load-chart.jar,
that allows you to execute the sample with a double click from a
file browser. Note that if you are using Internet Explorer, you can
open the installation directory
and execute the JAR file from the browser. This
technique may not work in other Web browsers.
Alternatively, you
can run the sample application from the command line.
First check that the Ant utility is properly configured. If not, see the
instructions on how to configure Ant for Perforce JViews.
Then, go to the installation directory
of the sample and type:
ant run
Topics Covered
-
Creating an
IlvResourceDataChartto display the load for different resources -
Synchronizing the resources displayed in an
IlvResourceDataChartwith resources selected in anIlvScheduleChart -
Synchronizing the horizontal scrolling of an
IlvResourceDataChartand anIlvScheduleChart
Detailed Description
This sample illustrates the following:
- How to use an
IlvResourceDataChartto show the load for resources selected in anIlvScheduleChart. - How to synchronize the horizontal scrolling for an
IlvResourceDataChartandIlvScheduleChart.
Installation Directory
The Resource and Load Charts sample is installed here.
Classes Involved
- ilog.views.gantt.IlvScheduleChart
- ilog.views.schedule.IlvResourceDataChart
- ilog.views.chart.IlvChartAreaSynchronizer
- ilog.views.gantt.IlvTimeScrollController
Source Files
-
resourceLoadChart.LoadChartExample
The main class of the sample.