Perforce JViews Gantt Sample: Activity Chart (SDK)
Description
 |
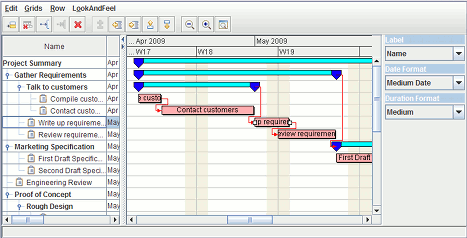
This sample shows a simple project scheduling application displayed as an activity-oriented Gantt Chart.
How to Use the Sample
-
On the left, an
IlvJTableobject shows the activity properties. The first column of the table shows the hierarchy of the activities in the form of a tree. You can click the expand/collapse icon to expand or collapse an activity, if it has child activities. The other columns are used to show more properties of the activities. -
On the right, the Gantt chart uses an
IlvGanttSheetobject to visualize the activities. Notice that parent activities are rendered differently from child activities. - At the top of the Gantt sheet the time scale appears.
-
This sample has the following keyboard accelerators:
- Ctrl+Z : zoom
- Ctrl+U : unzoom
- Ctrl+F : fit to view
- Ctrl+Enter : toggle selected row expand/collapse
- Ctrl+2 : increase row height
- Ctrl+Shift+2 : decrease row height
- Arrow Keys : scroll
- Refer to the Detailed Description part for more information on the different actions you can perform.
How to Run the Sample as an Application
This sample can
be run as an application.
The installation directory contains
an executable JAR file,
gantt-chart.jar,
that allows you to execute the sample with a double click from a
file browser. Note that if you are using Internet Explorer, you can
open the installation directory
and execute the JAR file from the browser. This
technique may not work in other Web browsers.
Alternatively, you
can run the sample application from the command line.
First check that the Ant utility is properly configured. If not, see the
instructions on how to configure Ant for Perforce JViews.
Then, go to the installation directory
of the sample and type:
ant run
Topics Covered
-
Creating an
IlvGanttChartobject for displaying activities - Creating a data model for the Gantt chart
- Entering activities in the data model and attaching the data model to the Gantt chart
- Interacting with the Gantt chart by using the installed menu, the toolbar, or the mouse.
Detailed Description
This sample shows a simple project scheduling application displayed as an activity-oriented Gantt Chart.
Selecting Activities
Many operations on the Gantt Chart apply to selected activities. The activities can be selected either in the activity table or in the Gantt sheet.
- To select an activity in the Gantt sheet, click on its graphic. You can make a multiple selection by dragging a rectangle over the activities, or by Shift-clicking on each activity to include.
- To select an activity in the activity table, click on its row. You can also change the selection by using arrow keys.
Editing Activity Properties with the Activity Table
The activity table is fully editable. You can change the properties of an activity by editing the table cells from your keyboard. If you change the start time or the end time of an activity, the change is immediately reflected in the Gantt sheet.
Interacting with the Gantt Sheet
You can have the following interactions with the Gantt sheet:
- You can select an activity in the Gantt sheet simply by clicking on it. You can also select several activities by Shift-clicking on them or by dragging a selection rectangle over them.
- You can move the selected activities horizontally by dragging them with the mouse.
- You can also resize a selected activity by dragging the start or the end of the activity graphic.
Zooming and Scrolling in the Time Scale
You can zoom and scroll in the time scale:
- Drag the time scale to scroll to the left or to the right.
- Press and move the mouse to select a time span, then click to confirm the zoom or press the Esc key to cancel.
- Double-click on a time span to zoom in.
Scrolling in the Table
You can use the up and down arrow keys, or the page up and page down keys, to scroll the table up and down.
Editing Activities
Creating and Deleting Activities
To create a new activity:
- Select an existing activity to indicate where the activity should be created.
- Choose "Insert activity" from the "Edit" menu.
To delete an existing activity:
- Select the activity to be deleted.
- Choose "Delete activity" from the "Edit" menu.
Moving an Activity in the Table
To change the hierarchical position of an activity:
- Select the activity.
- Choose "Indent activity", "Outdent activity", "Move up", or "Move down" from the "Edit" menu.
Creating and Deleting Constraints
To create a constraint:
- Select the "Create constraint" command from the "Edit" menu.
- Click in the Gantt sheet on the activity graphic from which you want to create a constraint (source, or From, activity).
- Click on the activity graphic to which you want to create a constraint (target, or To, activity).
You will notice that you can create different types of constraint depending on whether you click on the start or on the end of the From or To activity graphics.
Changing the Row Height of the Gantt Chart
The Gantt chart consists of activity rows. The height of the rows can be changed. The "Row" menu lists two commands that allow you to increase or decrease the row height of the Gantt chart.
Installation Directory
The Activity Chart (SDK) sample is installed here.
Classes Involved
- ilog.views.gantt.IlvGanttChart
- ilog.views.gantt.IlvGanttModel
- ilog.views.gantt.graphic.interactor.IlvGanttSelectInteractor
- ilog.views.gantt.graphic.interactor.IlvMakeActivityInteractor
- ilog.views.gantt.graphic.interactor.IlvMakeConstraintInteractor
Source Files
-
ganttChart.GanttExample
The Gantt chart sample.
-
shared.AbstractExample
The superclass of all Gantt chart samples.
-
ganttChart.CalendarDurationProperty
Allows the Calendar duration property to be displayed depending on a duration format.
-
shared.GanttCommand
Swing Actions used in the menus and toolbar.
-
shared.data.GeneralActivityFactory
The factory that creates numbered
IlvGeneralActivityinstances sequentially. -
shared.data.SimpleActivityFactory
The superclass of
GeneralActivityFactorythat creates numberedIlvSimpleActivityinstances sequentially.