The Region symbol displays the Key Performance Indicators for a
sales region. It is made up of the progress bar and stoplight
symbols created in Customizing
the progress bar and Creating
the stoplight symbol. The next sections describe:
Creating a background object
-
Open the bampalette.
-
In the toolbar, click New Symbol.A new symbol is created.
-
Click Rectangle.
-
Drag the mouse in the drawing pane to create the rectangle.
-
In the Transform tab of the Styling Customizer, set the Width field to 130 and the Height field to 300.See Performing basic object customization for more information.
-
In the Paint tab, set the Fill Paint style to RGB 204,255,255.See Changing the fill style for more information.
-
Delete the Shape and Text objects.For more information, see Deleting an object.
-
Create a category,
regions, in the bampalette.For more information, see Creating a new category. -
Save the symbol as regionbase in the regions category of the bampalette.
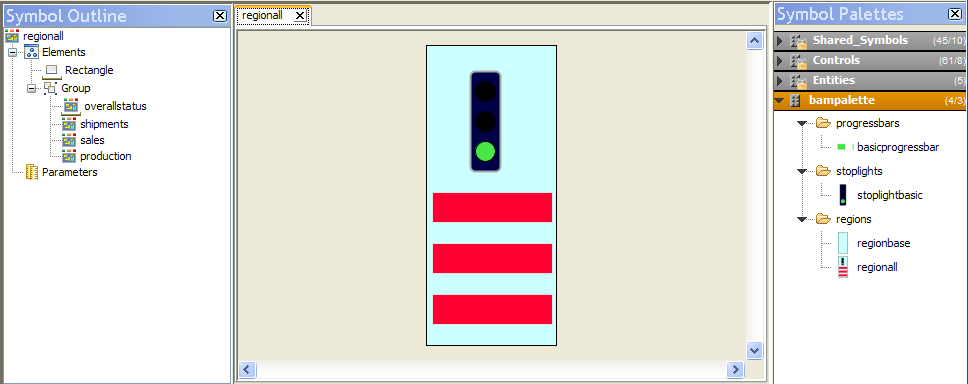
Adding symbols to a symbol
To match the dashboard in Definition of the dashboard, the Region
symbol needs three progress bars to demonstrate shipments, sales
and production. You will use the technique shown in Aligning and grouping multiple objects to
make multiple progress bars.
-
Open the regionbase symbol.
-
Drag the basicprogressbar symbol from the Symbol Palettes pane onto the regionbase symbol.
-
In the drawing pane, right-click the basicprogressbar object.
-
From the pop-up menu, select Copy.
-
Press Ctrl+V twice.You now have three progressbar objects: basicprogressbar, basicprogressbar2, basicprogressbar3.
-
Rename the three progressBar symbols as follows:
- shipments
- sales
- productionSee Performing basic object customization for more information.
-
Align, group and distribute the shipments, sales and production objects on the region background to resemble figure The region symbol.For more information, see Aligning and grouping multiple objects.
-
Drag the stoplightbasic symbol onto the Rectangle object.
-
Rename stoplightbasic to overallstatus.
-
Align and group the objects in the symbol.
-
Save the symbol as regionall in the regions category of the bampalette.
 The region symbol
 -
Test the regionall symbol.
Adding text to a symbol
When you have multiple indicators in a
symbol, use labels to show the data represented by the different
symbols.
To display which Key Performance
Indicator is being displayed:
-
Open the regionall symbol.
-
In the toolbar, click Text.
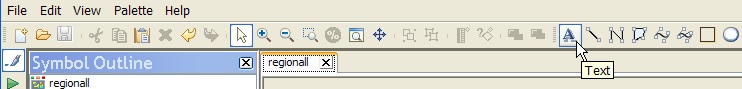 The Text button
 -
Click above the shipments progress bar.A text area is created.
-
In the text area, type
shipments. -
Repeat steps 2 to 4 for the sales and production progress bars.
-
Create a new String parameter called region.For more information, see Creating a new parameter.
-
Set the region parameter to have the following allowed values:
- Americas
- Europe
- AsiaFor more information, see Setting allowed values for a parameter.
-
Create an empty text area above the overallstatus object.To do this, press the space bar after creating the text area.
-
In the Styling Customizer, click the Text tab .
-
Right-click the Label field and click Enter an Expression in the pop-up menu.
-
Press Backspace until the list of values appears, then select
@regionfrom the list. -
Press Enter.
-
Set Alignment to Center.This text field now displays the default value of the region parameter.
-
Align all the symbols and objects in the regionall symbol.
-
Save and test the regionall symbol.
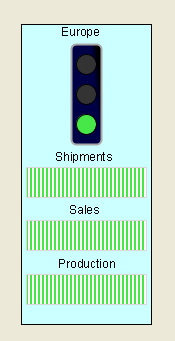
The improved regionall symbol