The gradient computation feature enables you to compute
a color-coded gradient chart that highlights where all the gradients
occur in a selected area of terrain. Gradient computations simplify
the task of identifying the flat and steep areas. You can change the
color model using the Gradient Style Settings window or the Property
Sheet. A new Gradient layer is created and displayed in the Map Layers
pane each time you carry out a gradient computation.
The following figure shows an example of a computed
gradient chart.
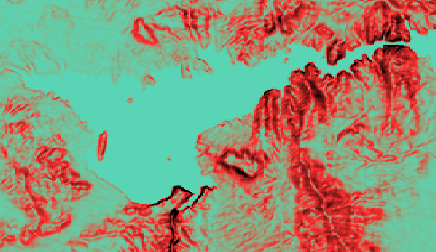
Gradient Computation
For more information about gradient computations and
how to set the gradient properties in the Gradient Style Settings
pane, see Creating a gradient computation.