The valley computation feature enables you to compute
a color-coded valleys and summits chart that highlights all the peaks
and troughs in a selected area of terrain. The valleys and summits,
that is the highest and lowest points, are highlighted by the different
colors. You can change the color model using the Valley Style Settings
window or the Property Sheet. A new Valley layer is created and displayed
in the Map Layers pane each time you carry out a valley computation.
The following figure shows an example of a valley computation.
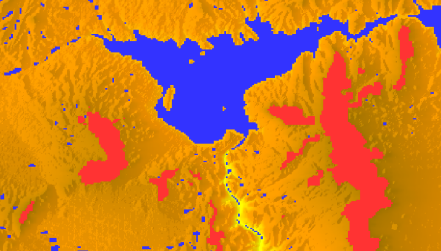
Valley computation
For more information about valley computations and how
to set the valley properties in the Valley Style Settings pane, see Creating a valley computation.