Today's defense operations require full appreciation
of the battlefield environment, both for mission planning and execution.
Applications such as C4ISR systems need to:
- Aggregate incoming data from multiple sources and grid data fields (satellites, UAVs, GPS, or other deployed sensors in network-enabled environments).
- Create a Common Operational Picture (COP) that mixes all of the above information to create exhaustive and meaningful battlefield representations.
- Display data in an intuitive, standardized, and user-friendly human-machine interface (HMI) across all levels of operational support to provide a standard set of representation symbols (symbology) that improve operators' ability to make rapid decisions and reduce the risk of errors.
Rogue Wave JViews Maps for Defense is the solution to help you deliver
such displays providing:
- Performance together with multithreaded development components, which enable more responsive applications, leave more CPU for other application-intensive tasks, and result in a better end-user experience.
- Flexibility, so that you can easily enrich existing applications or design and build new ones according to your requirements.
- Richness, to minimize your coding work.
Rogue Wave JViews Maps for Defense consists of development libraries
and a set of tools that handle both the map background and the symbology
to be placed on top of it. These symbols are graphic objects that
represent the assets and the entities you need to visualize at their
given locations. With Rogue Wave JViews Maps for Defense you can:
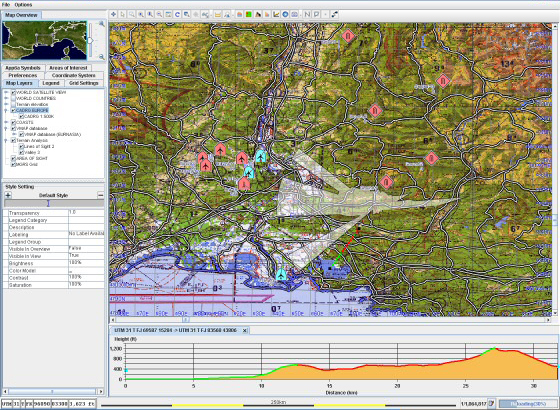
- Prepare your maps either programmatically or with the map preparation tool. This allows you to import map data and control precisely the look and feel of its representation. You control what you want to see, when and how.
- Create custom interactive and data-driven symbology or use the MIL-STD 2525b, NATO APP-6a or S52 libraries provided to represent the monitored entities.
- Facilitate mission planning and the placement of entities using the Terrain Analysis features.
- Efficiently animate the maps and symbols you have created with leading-edge performance even on large data sets and numerous animated entities.
Delivering these displays requires extensive and in-depth
knowledge of both mapping and efficient graphic displays. Rogue Wave JViews Maps for Defense hides the complexity of building
such displays by handling all of the lower-level "mapping engine"
functionality. Java developers can concentrate on the data they want
to display, rather than map formats, projections, efficient management
of huge data sets, overlapping labels, spatial reference systems,
and so on. As with all Rogue Wave JViews
products, Rogue Wave JViews Maps for Defense can easily be deployed as an application,
applets, Java Web Start, or interactive thin-client applications.
Don't miss these features!
Rogue Wave JViews Maps for Defense offers a wide range of features to
help user interface developers create state-of-the-art displays. These
include:
- Map Builder, which is a map preparation tool delivered as source code that allows you to jump start your developments. You can mix and match raster, elevation, and vector map information regardless of their parameters.
- 3D Map Views that are easy to use for non 3D experts (they use longitude, latitude and elevation as references) and providing advanced features such as direct visualization with no pre-processing required, map layer texturing, and adaptive terrain refinement.
- Advanced AJAX thin client deployment for browser-based applications.
- Full support for asset management maps, with custom graphical objects that update themselves efficiently when the underlying data changes.
- A full spectrum of map display capabilities, including the most popular data format readers and writers, geodesic computations such as projections, ellipsoids and DATUMs as well as over 1,500 predefined coordinate systems.
- Creation and animation of multi-layered and multi-scale maps with user-defined visual representations such as colors or transparency.
- Contextual grids in Longitude and Latitude or in the MGRS system with minimized memory and CPU footprint.
- Multiple coordinates and measuring unit systems.
- Performance features, such as load-on-demand, pixel-on-demand and map simplification through generalization for handling very large data sets while minimizing memory footprint.
- Advanced map labeling as well as the standard set of interactions such as panning, zooming, selection, and annotation.
- Terrain analysis features such as Area of Sight, Line of Sight, or gradient computation for improved context understanding and more efficient decision making.
- A set of map data, covering the entire world in different resolutions, in both raster and vector formats.