To create a gradient computation:
-
Set the map to the position and zoom level you require.
-
Click the
 button on the toolbar and then draw a
rectangle on the map where you want to compute the gradient.
button on the toolbar and then draw a
rectangle on the map where you want to compute the gradient. -
Set the gradient properties in the Gradient Style Settings pane and click OKThe following figure shows an example of the Gradient Style Settings.
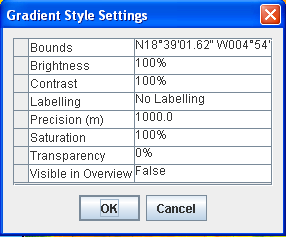 Gradient Style Settings pane
 -
The color-coded gradient is displayed in the rectangle you have drawn and a Gradient layer is added to the Map Layers pane. You can change the colors of the Slope data displayed using the
Color Modelproperty.NoteTo access theColor Modelproperty, you must have the Show Advanced Properties option active (Options>Show Advanced Properties). -
To delete a Gradient Layer, see Deleting a map layer.
-
You can also set the properties in the map style property sheet after the layer has been created