Map Builder features
Provides descriptions of the main features of the Map Builder.

Describes the Map Overview pane of the Map Builder.
Describes different ways symbols can be added to maps.
Explains how to use
JViews Diagrammer to design symbols to represent nodes and links.
Describes layer properties that can be customized using the Map Style Property Sheet.
Describes inheritance between layers and sublayers of properties defined in the Map Style Property Sheet.
Describes the purpose of the Areas of Interest pane.
Describes the scale bar and scale control panes in Map Builder.
Describes the preferences tab of the Map Builder.
Describes the ways coordinate systems can be set in Map Builder.
Describes the use of of labels on map layers and sublayers.
Describes the purpose and use of annotations on maps.
Describes the purpose and use of displaying grids on maps.
Describes the purpose and use of map magnification.
Describes the map rotation feature.
Describes the compass feature of Map Builder.
Describes features that can be set in the Advanced Settings pane.
Describes information that is found in the legend pane.
Describes additional tabs that can be displayed or hidden in the views pane.
Describes the the information displayed in the Data Sources pane and what you can change in it.
Describes the features offered in the Printing tab.
Describes the information displayed in the Multithread monitor pane.
Describes the Measures layer you obtain when using the orthodromy measure feature.
Describes the option of generating tiled images of a map for a thin client.
Describes the features available in the Zoom Configuration pane.
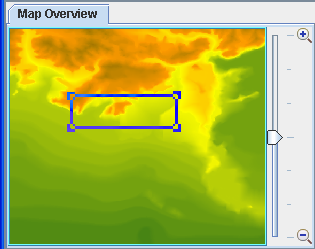
Overview pane
The Overview pane displays a representation of the current map that enables you to navigate to a part of it that is of particular interest, and display it in the Map Builder main window. This is done by clicking on and dragging the rectangle to the position of interest in the Overview pane, and then releasing the mouse button.
You can choose which map layer you want to display in the Overview pane by setting the
Visible in Overview property for each layer, see
Using the map style property sheet. This prevents cluttering of the pane.
A zoom in/zoom out slider is provided to the right of the Overview pane. Moving the slider pointer will zoom in or out constantly until the user releases it. Zooming speed increases with the distance of the slider from the center point.
The following figure shows an example of the Overview pane.
Map Overview pane
Symbols
Symbols in the Map Builder
The Map Builder allows you to select, configure symbols, and add them to a map. When you add symbols to a map, they are displayed in the Map View and also in any 3D Views that may exist. Such symbols will be saved along with the map. You should not use
JViews Diagrammer Designer with this type of map. See also
Symbol groups.
Symbols with JViews Diagrammer Designer
You can use the Map Builder to create a map and then load the map into the Designer for JViews Diagrammer and add nodes or links to the model.
Symbols from palettes in JViews Maps
You can select items from symbols palettes in JViews Maps and drag-and-drop symbols onto your map. Symbols can also be edited.
For more information see
Adding a new symbol from a palette in
Using more Map Builder featuresSymbol groups
You can also collect symbols together as a group and define whether the group is visible or not. The symbol groups are displayed in a pane in the Map Builder under the Symbols tab.
The following figure shows an example of symbol groups displayed in the Symbols pane.
Symbols pane
The Symbols pane has its own toolbar, which allows you to manage symbols or symbol groups by:
Creating and deleting them
Duplicating a symbol
Editing them
Making them visible or invisible
These commands are also available from a pop-up menu when you right-click a symbol or group. You can define a group in any way you want.
Using JViews Diagrammer Designer to design symbols
To create symbols in JViews Diagrammer for use in Map Builder:
1. Edit the map with the Map Builder and then save it.
2. Open Designer, use the map as the backdrop and add nodes or links to the model.
3. Use the Symbol Editor to choose or design the symbols that you want to represent the nodes or links and then save the whole as a diagrammer project.
4. Load the diagrammer project in your application.
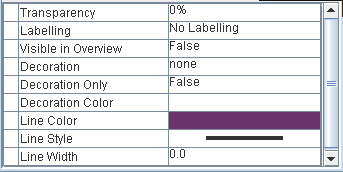
Properties
Each map layer has a set of properties associated with it. The properties define the characteristics of the selected layer. Using the Map Style Property Sheet you can customize the kind of map data selected (vector, raster, or elevation), define whether the map outline is shown or not, what colors are used to fill the terrestrial and marine areas, define the transparency level, and so on. The Map Style Property Sheet gives access to a number of editors that enable you to carry out these operations.
For example, for the Labeling property, a choice of label types is displayed that depends on the content of the data source. This enables you to display labels, for example, as the name of the country, or at a more detailed level such as the name of a street. You can change any property value at any time. The properties defined for each map layer constitute a layer style and each layer style contributes to the overall map theme.
Note that some properties are not displayed in the Map Style Property Sheet by default. To display all the properties you must select Options>Show Advanced Properties.
The following figure shows an example of a Map Style Property Sheet.
Map Style Property Sheet example
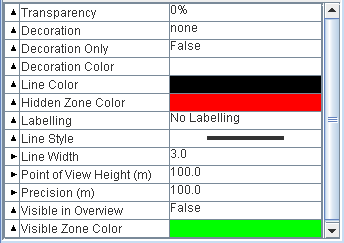
Sublayer properties
When a sublayer is selected in the Map Layers pane, the Map Style Property Sheet displays the properties for that layer prefixed with either an Up Arrow or a Right Arrow. The Up Arrow indicates that the sublayer property value is inherited from the parent layer and must be changed in the parent layer style sheet. The Right Arrow indicates that the property has its own, independent value that can be set at any time.
Inheritance is applied as follows:
Sublayers can inherit almost all properties that are present in the parent layer. There are some exceptions such as the
Color Model property.
All sublayer properties are added to the parent layer Map Style Property Sheet, if not already present.
The following figure shows an example of a sublayer Map Style Property Sheet.
Sublayer properties
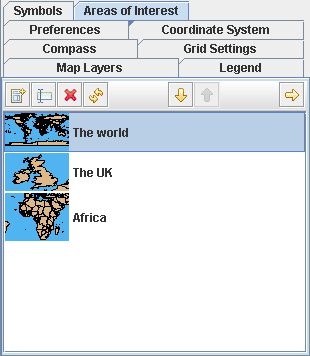
Areas of Interest
You can select areas of a map that are of particular interest to you and save them for future reference. Areas of Interest are similar to using the bookmark function of a browser. This enables you to quickly switch between any parts of a map that you have saved in this way. It could be based on traffic monitoring such that you can easily navigate between known congested areas to study their status (for example, red=congested, green=uncongested). It could be based on areas where particular military hardware is stored, ammunition dumps, battalions of soldiers, and so on.
The areas of interest are managed in a pane in the Map Builder under the Areas of Interest tab as shown in the following figure.
Areas of Interest pane
For more information, see
Managing areas of interest.
Map scale pane
Scale bar
This pane at the bottom of the Map Builder main window displays a scale bar that enables you to estimate distances in the displayed map. You can change the units in which the distances are displayed using the Preferences pane.
The following figure shows an example of the scale bar.
Scale bar pane
For more information, see
Setting preferences.
Scale control
This pane at the bottom of the Map Builder main window displays the scale of the map currently displayed. The scale changes automatically when you zoom in or out. This pane also enables you to set the scale of the map interactively.
The following figure shows an example of the scale control pane.
Scale control pane
For more information, see
Setting the map scale.
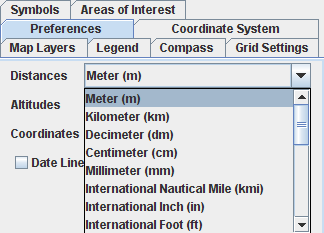
Preferences
Preferences enable you to set distances, altitudes, and coordinates in the units of your choice. The preferences are displayed in a pane in the Map Builder under the Preferences tab. You can change preference settings at anytime and the changes take place immediately. The preference settings can affect, for example, the units of the altitude charts used in terrain analysis, the orthodromy measures drawn on the map, the scale bar, and mouse locator units.
You can select the units from a list in the preferences tab, as shown in the following figure.
Preferences pane
The Date Line Wrapping option can be used to cut polygons that circumnavigate the world. Note that this option is only applied when the next reprojection occurs, for example, when you change the center of the projection.
For more information, see
Setting preferences.
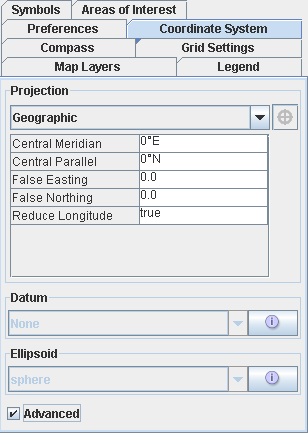
Coordinate systems
You can set your map coordinate system using one of two ways:
Coordinate system tab
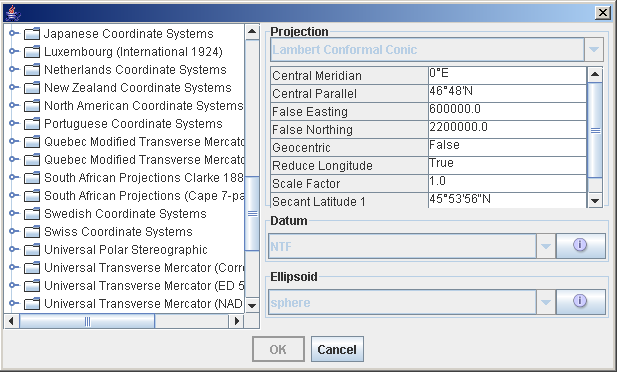
The coordinate system enables you to set the type of projection that you want to apply to your map and the projection properties. The current projection is displayed in a pane in the Map Builder under the Coordinate System tab. You can change the projection at anytime.
For example, you may want to display your maps using the UTM Zone6 coordinate system, which is a transverse mercator projection centered at 147˚W, with a false easting, and which uses the GRS80 ellipsoid and North American 1983 (CONUS) datum. These parameters are available by selecting the Advanced settings in the Coordinate System pane.
A coordinate system is presented as a projection and parameters, plus its datum and ellipsoid as shown in the following figure.
Coordinate System pane
Predefined Coordinate System pane
The Predefined Coordinate Systems pane (choose Options>Predefined Coordinate Systems to display this pane) lists all the known systems and settings that are normally used. The list is built on an historical and country basis. The Predefined Coordinate Systems pane also provides a preview of the selected coordinate system. Note that when you set the coordinate system from this pane, it is automatically updated in the Coordinate System pane.
The following figure shows an example of a Predefined Coordinate System pane.
Predefined Coordinate System pane
For more information, see
Setting coordinate systems.
Labels
Labels on Layers
You can choose to display labels on your map to help with identification of the various parts. Typically the labels could be the name of the country or continent, the abbreviation usually used for a given country, the name of a road or installation, and so on. A list of label types is proposed (if available) when you select the Labeling property of a layer in the Map Style Property Sheet.
The label types for a given layer are contained in the map data and are reflected in the list. When you add labels to a layer for the first time, a Labels layer is created in the Map Layers pane.
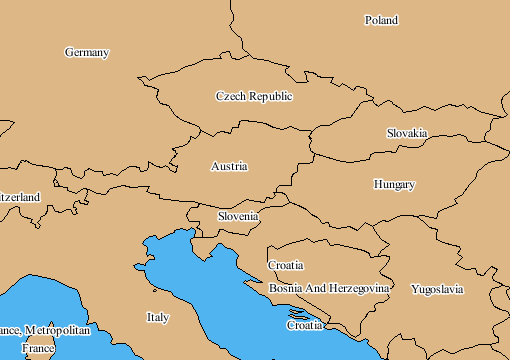
The following figure shows an example of a map with NAME labels for countries.
Labels
For more information, see
Displaying labels.
Labels on Sublayers
Labels sublayers give you the possibility to label each vector layer differently. For example, the labels can be:
Centered for areas and countries
Along polylines for roads
In addition, it is important to distinguish the visible differences between road, motorway, and state or county labels to make the map more readable. You can do this by setting the font size, fill color, whether the outline is drawn, and if so what the outline color will be. See
Using the map style property sheet and
Setting sublayer properties for more information on how to use the Property Sheet.
Each time you set the Labeling property for a displayed data source containing label information, a Labels for: sublayer is created in the Map Layers pane under the Labels layer. You can then specify the style of labeling for each Labels sublayer using the corresponding Property Sheet.
The order of the Labels sublayers in the hierarchy defines the priority of the labeling. When the labeling is performed, the labeler places as many labels as possible on the first layer in the hierarchy, and then considers the placement of labels on the next Labels sublayer, and so on.
You can then specify the priority of the labeling by reordering the Labels sublayers. This enables you to distinguish between the labeling layers more easily and prevent the view becoming too complex. Note that the layer with the highest priority is situated at the bottom of the stack.
The following figure shows an example of customized Labels sublayers.
Customized Labels sublayers
For more information, see
Displaying labels.
Annotations
An annotation is a drawing made on the top of a map to describe or provide additional information about a specific zone of a map. Annotations are labeled and are projected with respect to the coordinate system of the map. Labels can be created to provide text information and are displayed using the JViews Maps labeling mechanism, (see
Editing annotation labels). You can also add a description to an annotation that can be multiline, formatted using HTML tags, and displayed as a tooltip when the mouse is held over the annotation.
You can use map annotations to add, for example, specific points, borders, sections, divisions, limits, or areas of interest to your map, (see
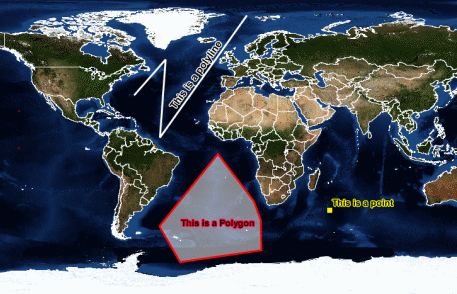
Creating annotations). There are several types of annotation that you can add:
Points
Polylines
Polygons
Links
Each time you create a point, polyline, polygon or link, it is added to the annotations layer in the Map Layers pane.
You can customize the annotations in a number of ways and can also carry out management operations on them. For example, you can change the line width, change the fill color, modify the label, and make the annotation visible or invisible. In the case of polylines and polygons, you can add or remove a point to or from the annotation and drag a point to another position to change the shape.
The following figure shows an example of annotations
Adding Annotations to a Map
For more information about annotations, how to manage them, and how to set their properties, see
Managing annotations.
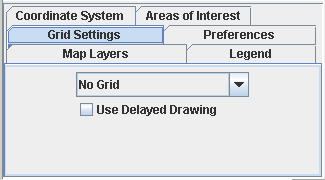
Grid Settings
Grid settings enable you to choose between having no grid displayed on the map or having a Military Grid Reference System (MGRS) or a latitude/longitude grid displayed. The grid settings are displayed in a pane in the Map Builder under the Grid Settings tab. You can select the grid type from a list.
The following figure shows a Grid Settings pane.
Grid Settings pane
When the Use Delayed Drawing option is selected, there is no full drawing of the grid when the map changes or moves, for example, when you use the zoom control in the Overview pane or pan the map. Full drawing of the grid only occurs when there is no movement or change to the map. This avoids unnecessary grid drawing, which results in improved performance and response time.
When you add a grid to a layer a Grid layer is also created, which enables you to set the corresponding properties (colors, fonts, and so on). See
Using the map style property sheet for more information.
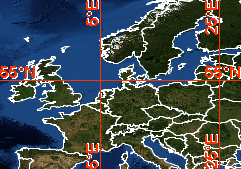
The following figure shows an example of a Latitude\Longitude grid.
Grid display
For more information, see
Displaying a grid.
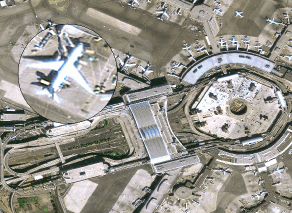
Map magnification
Map magnification enables you to magnify a selected part of the map of particular interest to you. A circular area around the position of the mouse is magnified. This area moves with the mouse as you move it around the map and is displayed until you release the mouse button.
The following figure shows an example of map magnification.
Map magnification
For more information, see
Magnifying part of a map.
Map rotation
Map rotation enables you to rotate a map to any angle in any direction. A compass is displayed to help you set the angle through which you want to rotate the map.
The following figure shows an example of map rotation.
Map rotation
For more information, see
Rotating a map.
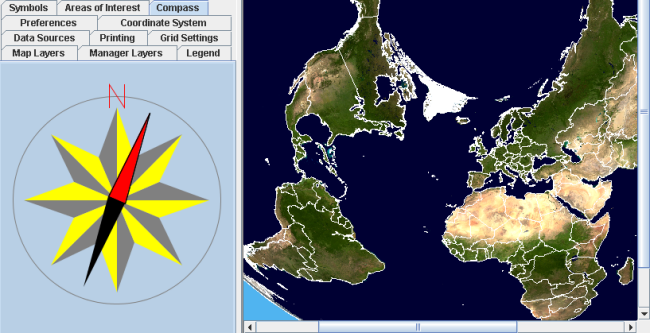
Compass
A Compass tab in the left of the Map Builder enables you to show a compass. This is useful when your map is displayed using a coordinate system that makes it difficult to recognize the direction.
If you change the projection of your map to, for example, Albers Equal Area and then zoom in a number of times, you may lose your sense of direction. However, if you click the Compass tab you will see that it always indicates north as seen from the center of the view.
The following figure shows the Compasstab with the compass indicating north.
Compass tab
For more information, see
Using the Compass.
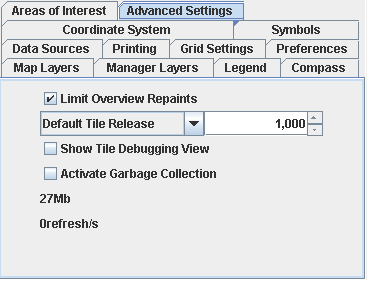
Advanced Settings
The Advanced Settings pane (if this tab is not visible see
Additional views) provides the following options:
Limit Overview Repaints Limits the Overview pane to not more than two refreshes per second to reduce CPU usage. When you are zooming or manipulating the main view, it is not always necessary for the Overview pane to be refreshed as often of the main view. This option is set by default.
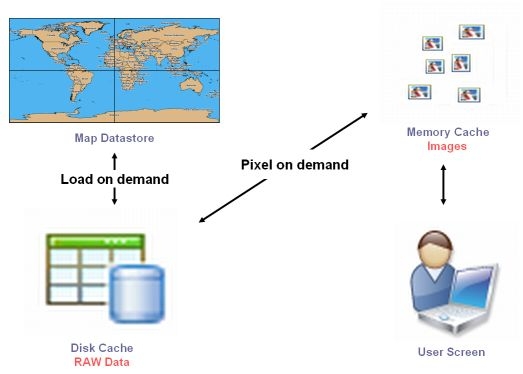
Default Tile Release Determines the way image tiles are kept in memory or dumped on the hard disk cache area (tiles are parts of each image). This determines what happens when you pan or zoom the map. To improve performance, already-computed images are stored in the cache ready for when you pan or zoom back. This value represents the number of tiles kept in memory, not the size in KB or MB.
The following figure shows how the caching mechanism works.
Caching Mechanism
Show Tile Debugging View Displays a view of the existing tiles for debugging purposes.
Activate Garbage Collection Activates a timer that periodically cleans as much unused memory as possible.
Memory Usage and Refresh Displays the memory used by the application and the refresh rate (in seconds) for the redisplay of images.
The following figure shows an example of the Advanced Settings pane.
Advanced Settings pane
For more information, see
Using Advanced Settings.
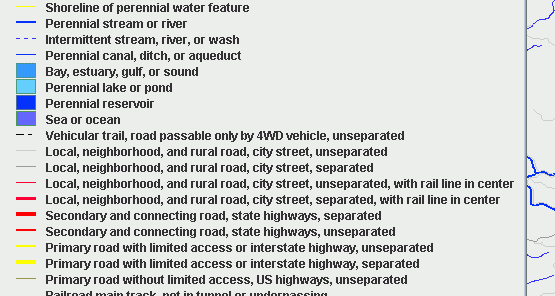
Legend
The Legend pane (if this tab is not visible see
Additional views) provides a map with explanatory notes that describe what objects in the map represent, for example, highways, primary and secondary roads, and so on. This is the typical sort of legend that can be found on most paper maps. Entries in the Legend pane are added automatically when you add a new layer. If the data source is complex, the entries in the Legend pane are displayed according to your choice of features when you import the file. For example, if you import a data source and choose Transportation (Roads) as a feature, the Legend pane will show an entry for secondary routes, causeways, and trails. You can organize your map legend differently using the advanced properties of the layers, such as
Legend Category and
Legend Group.
The following figure shows an example of the Legend pane.
.
Legend pane
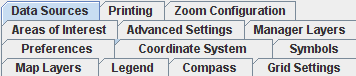
Additional views
There are several views available to you that are not displayed by default. You can access these views by choosing Options>Show Additional Views in the Map Builder main window. This opens the Unused Views pane, which displays the following additional view tabs:
Data Sources
Printing
Advanced Settings
Zoom Configuration
You can drag and drop any combination of these views into the pane on the left of the Map View. The configuration you choose is saved and redisplayed the next time you start the Map Builder. This feature enables you to set up the views pane in a way that makes the tabs you use the most readily available. You can hide those you do not use much by dragging and dropping them back into the Unused Views pane.
The following figure shows an example of the complete set of tabs in the views pane.
Additional views
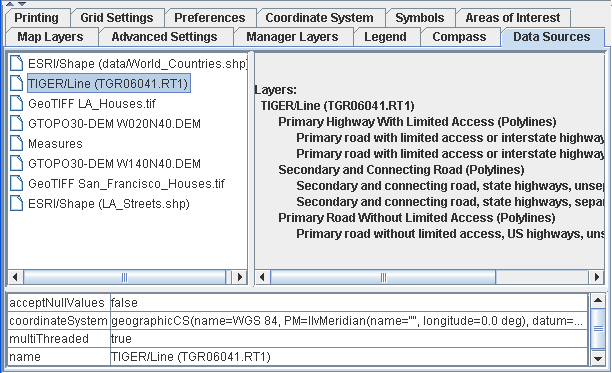
Data sources
Data sources can be of several types. Some data sources provide only a simple map backdrop, while others can provide details down to street level, describe water facilities, transport facilities, and so on. Normally, one data source is equivalent to one map data file or one database query. However, when reading multiresolution maps such as CADRG, there is one data source per resolution.
The Data Sources pane (if this tab is not visible see
Additional views) provides a list of all the data sources currently imported into the Map Builder and their corresponding properties. Typically the properties define the coordinate system applied to the data source and the name of the file in which the data is held. The complete set of properties in the list depends on the type of data source selected.
You can select a data source in the list, change its properties at any time, or remove it from the list.
The following figure shows an example of the Data Sources pane.
Data Sources pane
For information about how to use the Data Sources pane, see
Using the Data Sources pane and for information about how to import a data source, see
Importing a simple data source.
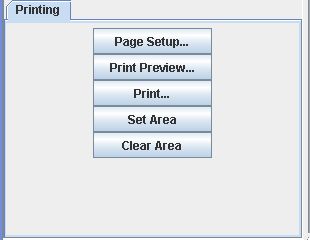
Printing Features
The
Printing tab (if this tab is not visible see
Additional views) provides you with standard print facilities for printing a copy of the map displayed. You can also select and print a part of the map that is of particular interest to you.
The following figure shows an example of the Printing pane.
Printing pane
For more information, see
Printing a map.
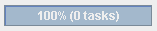
Multithread monitor
This small pane at the lower right of the Map Builder main window displays the status of already initiated actions. For example, you can start to import several data sources simultaneously. The Multithread monitor pane shows the number of tasks initiated and the progress of each task in turn. When one or more tasks are in progress, a red square is displayed in the upper left corner of the Map view.
You can use the Multithread monitor to display details of which threads are running and what their purpose is. When finished, the Multithread Monitor pane should show 100% (0 tasks).
The following figure shows an example of a Multithread Monitor pane.
Multithread monitor pane
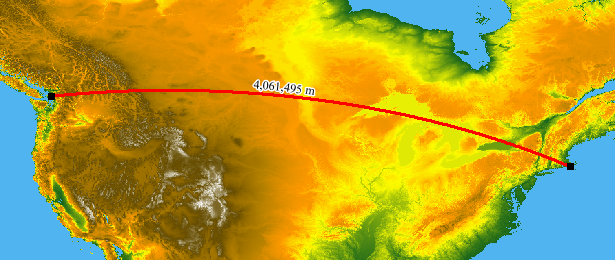
Orthodromy Measures
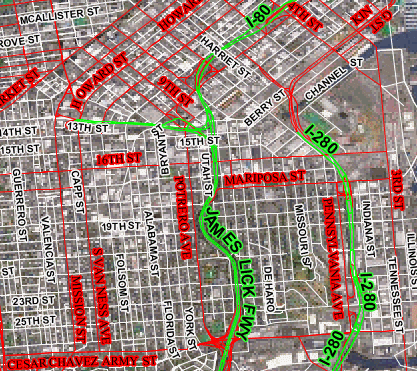
An orthodromy measure is represented by a line on a map. This is useful for defining the shortest distance between any two points selected on the map. The total distance between the two points is computed and displayed next to the line. Depending on the length of the line and the zoom scale, the line may not be straight due to the curvature of the Earth. A Measures layer is added to the Map Layers pane.
The following figure shows an example of a Measures layer with a curved orthodromy measure displayed.
Orthodromy measure
For more information about Orthodromy measures and how to set their properties, see
Creating an orthodromy measure.
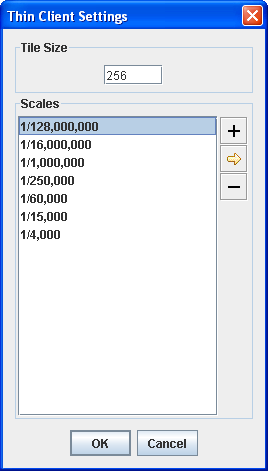
Tiled Images for a Thin Client
If you are operating using a thin client, you can generate tiled images of a map at different scales (zoom levels) and then save them in the cache of a thin-client server application. These tiled images can be used by the servlet as pre-rendered tile requests to speed up the response time of the server.
However, this is not mandatory since the server also has a cache. Using this function you can fill the cache with data at startup. The cache is initially empty, but is gradually filled with the most requested Map Views, regardless of whether it was pre-filled or not.
Two values need to be provided: Tile Size (the tile size in pixels) and Scales (a list of scales for which you want to generate the tiled images). You can do this in the Thin Client Settings pane.
The following figure shows an example of a Thin Client Settings pane.
Set Thin Client Parameters pane
A graphical tool to interactively generate tiles is provided as a code sample in:
<installdir> /jviews-maps/samples/tilegeneration/src/TileGenerator.javaZoom Configuration
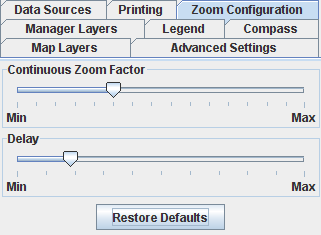
The Zoom Configuration tab (if this tab is not visible see
Additional views) provides facilities to customize the delay and zoom factor for the continuous zoom mechanism. Continuous zoom permits a user to zoom into or out from a map by pressing and holding a mouse button.
The delay factor is the time interval between zoom operations, the zoom factor is the amount that is zoomed for each zoom operation.
The following figure shows the Zoom Configuration default settings.
Default Zoom Configuration settings.
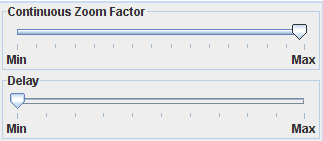
To set the continuous zoom tool to zoom as rapidly as possible, set the Continuous Zoom Factor to Max and the Delay to Min.
The following figure shows the Continuous Zoom Factor set to Max and the Delay set to Min used to obtain the fastest zoom.
Fastest Zoom Configuration settings
Copyright © 2018, Rogue Wave Software, Inc. All Rights Reserved.