
Rogue Wave Views 5.6
Rogue Wave Views
Charts Package API Reference Guide
Rogue Wave Views
Documentation Home
Rogue Wave Views 5.6 |
Rogue Wave Views |
Rogue Wave Views Documentation Home |
Base class for single displayers. More...
#include <ilviews/charts/display.h>
Public Member Functions | |
| virtual | ~IlvSingleChartDisplayer () |
| Destructor. | |
| virtual IlvChartDisplayerPoints * | allocDisplayerPoints () const |
Allocates and returns an IlvChartDisplayerPoints object. | |
| virtual IlBoolean | boundingBox (IlvRect &bbox, const IlvTransformer *t=0) const |
| Returns the bounding box of the graphical representation of data. | |
| virtual IlBoolean | dataPointBBox (IlUInt dataPtIdx, IlvRect &bbox, IlBoolean takeInfoIntoAccount=IlTrue, const IlvTransformer *t=0) const |
| Returns the bounding box of the graphical representation of the data points at a given index. | |
| virtual void | draw (IlvPort *dst, const IlvTransformer *t=0, const IlvRegion *clip=0) const |
| Draws the graphical representation of data. | |
| virtual void | drawDataPoint (IlUInt dataPtIdx, IlvPort *dst, const IlvTransformer *t=0, const IlvRegion *clip=0) const |
| Draws the graphical representation of the data point(s) at a given index. | |
| virtual void | drawDataPoints (IlUInt iMin, IlUInt iMax, IlvPort *dst, const IlvTransformer *t=0, const IlvRegion *clip=0) const |
| Draws the graphical representation of the data points between a given interval. | |
| virtual void | drawFill (IlBoolean b) |
| Sets the filling mode of the displayer. | |
| virtual void | drawLegendItem (IlvPort *dst, const IlvRect &legendArea, IlvPalette *itemPal, const IlvRegion *clip, IlAny clientData=0) const |
| Draws the graphic part of a legend item associated with the current displayer. | |
| virtual IlvColor * | getBackground (IlUInt index=0) const |
| Returns the background color of a palette used by the current displayer to display data. | |
| virtual void | getClipArea (IlvRect &area, const IlvTransformer *t) const |
| Returns the clipping region that is used for the drawing. | |
| void | getDataDisplayArea (IlvRect &dataDisplayArea, const IlvTransformer *t=0) const |
| Returns the bounds of the data display area. | |
| IlvChartDisplayerPointsFactory * | getDisplayerPointsFactory () const |
Returns the factory used to create IlvChartDisplayerPoints instances. | |
| virtual IlUInt | getDisplayersCount () const |
| Returns the number of displayers. | |
| virtual IlUInt | getDisplayItem (IlvChartDataSet *&dataSet, const IlvPoint &viewPoint, const IlvTransformer *t) const |
| Returns the item to which a view point corresponds. | |
| virtual IlBoolean | getDisplayPoint (const IlvChartDataSet *dataSet, IlUInt dataPtIdx, IlvPoint &point, const IlvTransformer *t=0) const |
| Returns the corresponding screen point for a data point. | |
| virtual IlvColor * | getForeground (IlUInt index=0) const |
| Returns the foreground color of a palette used by the current displayer to display data. | |
| virtual const char * | getInternalLegendText (IlUInt index=0) const |
| Returns the legend text stored in the current displayer. | |
| virtual const char * | getLegendText (IlUInt index=0) const |
| Returns the text that will be used in a legend for the current displayer. | |
| virtual IlUInt | getNearestPoint (IlvChartDataSet *&dataSet, const IlvPoint &viewPoint, IlvDim distance, IlvPoint &point, const IlvTransformer *t=0) const |
| Returns the nearest data point. | |
| virtual IlvPalette * | getPalette (IlUInt=0) const |
| Returns a palette used by the current displayer to display data. | |
| virtual IlvPointInfoCollection * | getPointInfoCollection (const IlvChartDataSet *dataSet) const |
| Returns the point information collection defined to be used to display a given data set. | |
| IlvPos | getShiftOffset () const |
| Returns the offset by which the graphical representation of data is shifted along the base of the chart. | |
| virtual IlvDim | getSizeAlongBase () const |
| Returns the size along the base for the graphical representation of a given data point. | |
| IlBoolean | isDrawingFill () const |
| Returns the filling mode for the current displayer. | |
| virtual void | releaseDisplayerPoints (IlvChartDisplayerPoints *dispPts) const |
Releases an IlvChartDisplayerPoints object used by the current displayer. | |
| virtual void | setBackground (IlvColor *color, IlUInt index=0) |
| Sets the background color of a palette used by the current displayer to display data. | |
| virtual IlBoolean | setDataPoint (IlvChartDataSet *dataSet, IlUInt dataPtIdx, const IlvPoint &point, const IlvTransformer *t=0) const |
| Sets the corresponding data point from a screen point. | |
| IlvChartDisplayerPointsFactory * | setDisplayerPointsFactory (IlvChartDisplayerPointsFactory *factory) |
Sets the factory used to create IlvChartDisplayerPoints instances. | |
| virtual void | setForeground (IlvColor *color, IlUInt index=0) |
| Sets the foreground color of a palette used by the current displayer to display data. | |
| virtual void | setLegendItems (IlvChartLegend *legend) const |
| Sets the legend items associated with the current displayer. | |
| virtual void | setLegendText (const char *text, IlUInt index=0) |
| Sets the text that will be used in a legend for the current displayer. | |
| virtual void | setMode (IlvDrawMode mode) |
| Sets the drawing mode. | |
| virtual void | setOverwrite (IlBoolean o) |
| Sets the overwrite mode. | |
| virtual void | setPalette (IlvPalette *pal, IlUInt index=0) |
| Sets a palette used by the current displayer to display data. | |
| virtual void | setPointInfoCollection (const IlvChartDataSet *dataSet, IlvPointInfoCollection *ptInfoCollection) |
| Sets the point information collection that will be used to display a given data set. | |
| void | setShiftOffset (IlvPos offset) |
| Sets the offset by which the graphical representation of data is shifted along the base of the chart. | |
| virtual void | treatPointsOutOfAbscissaLimits (const IlvRect &dataDisplayArea, IlvChartDisplayerPoints *displayerPoints, const IlvCoordInterval &abscissaRange, const IlvPoint &minLimit, const IlvPoint &maxLimit) const |
| Treats the occurrence of points in screen coordinates that are outside the abscissa limits. | |
| virtual IlBoolean | usePointInfo () const |
| Indicates whether point information collections are defined. | |
| virtual void | write (IlvOutputFile &file) const |
| Writes the attributes of the current object in a file. | |
Protected Member Functions | |
| IlvSingleChartDisplayer (const IlvSingleChartDisplayer &displayer) | |
| Constructor. | |
| IlvSingleChartDisplayer (IlvInputFile &file) | |
| Constructor. | |
| IlvSingleChartDisplayer (IlvPalette *palette=0) | |
| Constructor. | |
| virtual void | boundingBoxOfItem (const IlvChartDisplayerPoints *displayerPoints, IlUInt pointIndex, IlUInt pointsCount, IlvPoint *points, IlvRect &bbox, IlBoolean takeInfoIntoAccount=IlTrue, const IlvTransformer *t=0) const |
| Returns the bounding box of the item drawn for a given point in screen coordinates corresponding to a data point to display. | |
| IlBoolean | boundingBoxOfPart (const IlvCoordInterval &abscissaRange, IlBoolean shiftOfCycleLength, IlvRect &partBBox, IlBoolean takeInfoIntoAccount, const IlvTransformer *t=0) const |
| Returns the bounding box of a part of the graphical representation of data. | |
| virtual void | boundingBoxOfPoints (IlvChartDisplayerPoints *displayerPoints, IlvRect &bbox, IlBoolean takeInfoIntoAccount=IlTrue, const IlvTransformer *t=0) const |
| Returns the bounding box of the graphical representation of projected points. | |
| virtual void | computeItem (const IlvChartDisplayerPoints *displayerPoints, IlUInt pointIndex, IlUInt &usedPointsCount, IlvPoint *points, const IlvTransformer *t=0) const =0 |
| Computes the item that will be displayed for a given point in screen coordinates corresponding to a data point to display. | |
| virtual IlBoolean | computeLimitsForDataSelection (const IlvRect &clipRect, const IlvCoordInterval &abscissaRange, const IlvCoordInterval &ordinateRange, IlvCoordInterval &abscissaSelectionRange, IlvCoordInterval &ordinateSelectionRange, IlBoolean &dataToSelect, const IlvTransformer *t=0) const |
| Computes the abscissa and ordinate intervals used to select the data to be displayed in a given rectangle. | |
| virtual void | drawItem (const IlvChartDisplayerPoints *displayerPoints, IlUInt pointIndex, IlUInt pointsCount, IlvPoint *points, IlvPalette *itemPalette, IlvPort *dst, const IlvTransformer *t=0, const IlvRegion *clip=0) const =0 |
| Draws the item for a given point in screen coordinates corresponding to a data point to display. | |
| void | drawPart (const IlvCoordInterval &abscissaRange, IlBoolean shiftOfCycleLength, IlvPort *dst, const IlvTransformer *t=0, const IlvRegion *clip=0) const |
| Draws a part of the graphical representation of data. | |
| virtual void | drawPointInfos (const IlvChartDisplayerPoints *displayerPoints, IlvPort *dst, const IlvTransformer *t=0, const IlvRegion *clip=0, const IlvChartDataSet *dataSet=0) const |
| Draws the point information defined for the data points to be displayed. | |
| virtual void | drawPoints (IlvChartDisplayerPoints *displayerPoints, IlvPort *dst, const IlvTransformer *t=0, const IlvRegion *clip=0) const |
| Draws the graphical representation from points in screen coordinates corresponding to the data points to display. | |
| virtual IlUInt | getItemPointsCount (const IlvChartDisplayerPoints *displayerPoints) const |
| Returns the maximum number of points needed to define an item for the current displayer. | |
| IlUInt | getNearestPointInsidePart (const IlvCoordInterval &abscissaRange, IlBoolean shiftOfCycleLength, IlvChartDataSet *&dataSet, const IlvPoint &viewPoint, IlvDim distance, IlvPoint &point, const IlvTransformer *t=0) const |
| Returns the nearest data point within a given abscissa range. | |
| virtual IlUInt | pointsContains (const IlvPoint &viewPoint, IlvChartDisplayerPoints *, const IlvTransformer *t=0) const |
| Returns the index of the data point of which the corresponding displayer item holds viewPoint. | |
| virtual IlvDoublePoint * | selectDataPointsForPoint (IlUInt dataPtIdx, IlUInt &count, IlUInt *&dataPtIdxes) const |
| Selects and returns the data points needed to be able to display the graphical representation of the data point(s) at a given index in the real data set(s) to be displayed by the current displayer. | |
| virtual IlvDoublePoint * | selectDataPointsForRange (const IlvCoordInterval &abscissaRange, IlUInt &pointCount, IlUInt *&dataPtIdxes, const IlvTransformer *t=0, const IlvRect *clip=0) const |
| Selects And returns the data points to display that are within a given abscissa interval. | |
| virtual IlvDoublePoint * | selectDataPointsInRect (IlUInt &pointCount, IlUInt *&dataPtIdxes, IlvRect pickRect, const IlvTransformer *t=0) const |
| Selects the data points of dataSet that are rendered within pickRect. | |
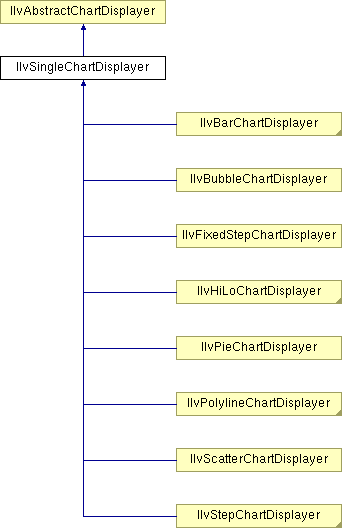
Base class for single displayers.
Library: ilvcharts
This class is an abstract subclass of IlvAbstractChartDisplayer that defines single displayers that display data with a single basic rendering shape. Examples of single displayers are displayers representing data with markers, polylines, bars, and so on.
IlvAbstractChartDisplayer, IlvBarChartDisplayer, IlvBubbleChartDisplayer, IlvHiLoChartDisplayer, IlvPieChartDisplayer, IlvPolylineChartDisplayer, IlvStepChartDisplayer, IlvScatterChartDisplayer, IlvChartDisplayerPoints. | virtual IlvSingleChartDisplayer::~IlvSingleChartDisplayer | ( | ) | [virtual] |
Destructor.
The destructor removes all the data sets in the collection of data sets that will be displayed by the current displayer, deletes the text defined to be used in a legend for the current displayer, and unlocks the palette used by the current displayer.
| IlvSingleChartDisplayer::IlvSingleChartDisplayer | ( | IlvPalette * | palette = 0 |
) | [protected] |
Constructor.
Initializes a new IlvSingleChartDisplayer instance. The shift offset and the text that will be used in a legend for the current displayer are set to 0 by default.
| palette | The palette used by the current displayer to display data. |
| IlvSingleChartDisplayer::IlvSingleChartDisplayer | ( | IlvInputFile & | file | ) | [protected] |
Constructor.
Initializes a new IlvSingleChartDisplayer instance from the description read in the input file named file.
| file | The file used to initialize the current displayer. |
| IlvSingleChartDisplayer::IlvSingleChartDisplayer | ( | const IlvSingleChartDisplayer & | displayer | ) | [protected] |
Constructor.
Initializes a new IlvSingleChartDisplayer instance as a copy of displayer.
| displayer | The object used to initialize the current one. |
| virtual IlvChartDisplayerPoints* IlvSingleChartDisplayer::allocDisplayerPoints | ( | ) | const [virtual] |
Allocates and returns an IlvChartDisplayerPoints object.
Allocates and returns the IlvChartDisplayerPoints object that will be used by the current displayer to project and render data. If a factory is associated with the current displayer, the IlvChartDisplayerPointsFactory::create method is used. If no factory is defined, an instance of the IlvChartDisplayerPoints class is returned.
IlvChartDisplayerPoints object. releaseDisplayerPoints. | virtual IlBoolean IlvSingleChartDisplayer::boundingBox | ( | IlvRect & | bbox, | |
| const IlvTransformer * | t = 0 | |||
| ) | const [virtual] |
Returns the bounding box of the graphical representation of data.
| bbox | The bounding box of the graphical representation of data displayed by the current displayer. | |
| t | The transformer that is applied to the returned bounding box. |
IlTrue if the bounding box has been successfully computed and IlFalse otherwise. Implements IlvAbstractChartDisplayer.
| virtual void IlvSingleChartDisplayer::boundingBoxOfItem | ( | const IlvChartDisplayerPoints * | displayerPoints, | |
| IlUInt | pointIndex, | |||
| IlUInt | pointsCount, | |||
| IlvPoint * | points, | |||
| IlvRect & | bbox, | |||
| IlBoolean | takeInfoIntoAccount = IlTrue, |
|||
| const IlvTransformer * | t = 0 | |||
| ) | const [protected, virtual] |
Returns the bounding box of the item drawn for a given point in screen coordinates corresponding to a data point to display.
The item drawn for a given screen point corresponding to a data point to display depends on the type of the displayer. For example, for a displayer that displays data with 3D bars, the item is a 3D bar extending from this screen point to the abscissa scale.
IlvSingleChartDisplayer::computeItem method. (See this method for more details.)| displayerPoints | The object that stores the points in screen coordinates that have to be displayed by the current displayer. | |
| pointIndex | The index of the point in screen coordinates corresponding to a data point to display for which we want to compute the bounding box of the corresponding item. | |
| pointsCount | The number of points defining the item. | |
| points | The points defining the item for which we want to compute the bounding box. | |
| bbox | The bounding box of the item. The returned bounding box is transformed by t. | |
| takeInfoIntoAccount | A Boolean value indicating whether the point information must be taken into account for computing the bounding box. | |
| t | The optional transformer. |
Reimplemented in IlvBubbleChartDisplayer, IlvPieChartDisplayer, and IlvScatterChartDisplayer.
| IlBoolean IlvSingleChartDisplayer::boundingBoxOfPart | ( | const IlvCoordInterval & | abscissaRange, | |
| IlBoolean | shiftOfCycleLength, | |||
| IlvRect & | partBBox, | |||
| IlBoolean | takeInfoIntoAccount, | |||
| const IlvTransformer * | t = 0 | |||
| ) | const [protected] |
Returns the bounding box of a part of the graphical representation of data.
Computes the bounding box of the graphical representation of the data that are within the abscissa interval defined by abscissaRange and returns it in partBBox.
| abscissaRange | The abscissa interval used to select the data for which the bounding box is computed. | |
| shiftOfCycleLength | A Boolean value indicating whether the data are shifted by the cycle length before being displayed. | |
| takeInfoIntoAccount | A Boolean value indicating whether the point information must be taken into account for computing the bounding box. | |
| partBBox | The returned bounding box of the graphical representation of the data that are within the abscissa interval abscissaRange. | |
| t | The transformer that is applied to the returned bounding box. |
IlTrue if the bounding box has been successfully computed and IlFalse otherwise.IlvSingleChartDisplayer::boundingBox method. Since the graphical representation is drawn by parts (see the IlvSingleChartDisplayer::drawPart method), the bounding box of the graphical representation of data is also computed by parts. Two parts are considered if the chart that uses the current displayer to display data is in cyclic mode (see the IlvChartGraphic::isInCyclicMode method). One part is for data that have not been shifted by the cycle length before being displayed, and the other part is for data that have been shifted by the cycle length before being displayed. (See the IlvCoordinateInfo::getFirstCycleRange and IlvCoordinateInfo::getSecondCycleRange methods for more details.) Otherwise, only one part is considered. | virtual void IlvSingleChartDisplayer::boundingBoxOfPoints | ( | IlvChartDisplayerPoints * | displayerPoints, | |
| IlvRect & | bbox, | |||
| IlBoolean | takeInfoIntoAccount = IlTrue, |
|||
| const IlvTransformer * | t = 0 | |||
| ) | const [protected, virtual] |
Returns the bounding box of the graphical representation of projected points.
Computes the bounding box of the graphical representation from the points expressed in screen coordinates that correspond to the data points to be displayed by the current displayer and returns it in bbox.
At this level of the class hierarchy, the method returns in bbox the bounding box of the points stored in displayerPoints and of the defined point information objects (if any and if the Boolean takeInfoIntoAccount is equal to IlTrue).
| displayerPoints | The object that stores the points in screen coordinates that have to be displayed by the current displayer. These points are considered to be already transformed by t. | |
| bbox | The bounding box of the graphical representation computed from the points in screen coordinates corresponding to the data to display. This returned bounding box is transformed by t. | |
| takeInfoIntoAccount | A Boolean value indicating whether the point information must be taken into account for computing the bounding box. | |
| t | The optional transformer. |
Reimplemented in IlvBarChartDisplayer, Ilv3dBarChartDisplayer, IlvBubbleChartDisplayer, IlvHiLoChartDisplayer, IlvPieChartDisplayer, IlvPolygonChartDisplayer, IlvStepChartDisplayer, IlvFixedStepChartDisplayer, IlvStairChartDisplayer, and IlvScatterChartDisplayer.
| virtual void IlvSingleChartDisplayer::computeItem | ( | const IlvChartDisplayerPoints * | displayerPoints, | |
| IlUInt | pointIndex, | |||
| IlUInt & | usedPointsCount, | |||
| IlvPoint * | points, | |||
| const IlvTransformer * | t = 0 | |||
| ) | const [protected, pure virtual] |
Computes the item that will be displayed for a given point in screen coordinates corresponding to a data point to display.
The item that will be displayed for a given screen point corresponding to a data point to display depends on the type of the displayer.
For example, for a displayer that displays data with 3D bars, the item that will be displayed for a given screen point corresponding to a data point to display is a 3D bar extending from this screen point to the abscissa scale.
The item that must be drawn is defined by twelve points corresponding to the corners of the three faces of the 3D bar that will be displayed.
IlvSingleChartDisplayer::getItemPointsCount method.| displayerPoints | The object that stores the points in screen coordinates that have to be displayed by the current displayer. These points are considered to be already transformed by t. | |
| pointIndex | The index of the point stored in displayerPoints for which we want to compute the corresponding item to display with the current displayer. | |
| usedPointsCount | The number of computed points defining the item. | |
| points | The points defining the item. These points are transformed by t. | |
| t | The transformer (if any) that is applied to the computed points. |
Implemented in IlvBarChartDisplayer, Ilv3dBarChartDisplayer, IlvBubbleChartDisplayer, IlvHiLoChartDisplayer, IlvHiLoBarChartDisplayer, IlvPieChartDisplayer, IlvPolylineChartDisplayer, IlvStepChartDisplayer, IlvFixedStepChartDisplayer, IlvStairChartDisplayer, and IlvScatterChartDisplayer.
| virtual IlBoolean IlvSingleChartDisplayer::computeLimitsForDataSelection | ( | const IlvRect & | clipRect, | |
| const IlvCoordInterval & | abscissaRange, | |||
| const IlvCoordInterval & | ordinateRange, | |||
| IlvCoordInterval & | abscissaSelectionRange, | |||
| IlvCoordInterval & | ordinateSelectionRange, | |||
| IlBoolean & | dataToSelect, | |||
| const IlvTransformer * | t = 0 | |||
| ) | const [protected, virtual] |
Computes the abscissa and ordinate intervals used to select the data to be displayed in a given rectangle.
Given the abscissa and ordinate intervals for all the data points displayed by the current displayer, this method computes the abscissa and ordinate intervals for the data points that will be displayed in the rectangle clipRect. These computed intervals will allow the data points that are needed to draw the part of the graphical representation that appears in the rectangle clipRect to be selected later.
| clipRect | The rectangle for which we want to compute the abscissa and ordinate intervals of the data points that are displayed inside this rectangle. | |
| abscissaRange | The abscissa interval of all the data points displayed by the current displayer. | |
| ordinateRange | The ordinate interval of all the data points displayed by the current displayer. | |
| abscissaSelectionRange | This parameter is used to return the abscissa interval of the data points that will be displayed in the rectangle clipRect. | |
| ordinateSelectionRange | This parameter is used to return the ordinate interval of the data points that will be displayed in the rectangle clipRect. | |
| dataToSelect | This parameter is used to return a Boolean value indicating whether there will be some data to select (that is, there will be some data points that will be displayed in the rectangle clipRect). | |
| t | The transformer (if any) that has been applied to clipRect. |
IlTrue if the intervals computation has been successfully performed and IlFalse otherwise. | virtual IlBoolean IlvSingleChartDisplayer::dataPointBBox | ( | IlUInt | dataPtIdx, | |
| IlvRect & | bbox, | |||
| IlBoolean | takeInfoIntoAccount = IlTrue, |
|||
| const IlvTransformer * | t = 0 | |||
| ) | const [virtual] |
Returns the bounding box of the graphical representation of the data points at a given index.
| dataPtIdx | The index of the data point(s) for which we want to get the bounding box of their graphical representation. | |
| bbox | The returned bounding box of the graphical representation of the data point(s). | |
| takeInfoIntoAccount | A Boolean value indicating whether the point information must be taken into account when the bounding box is computed. | |
| t | The transformer that is applied to the bounding box. |
IlTrue if the bounding box has been successfully computed and IlFalse otherwise. Implements IlvAbstractChartDisplayer.
| virtual void IlvSingleChartDisplayer::draw | ( | IlvPort * | dst, | |
| const IlvTransformer * | t = 0, |
|||
| const IlvRegion * | clip = 0 | |||
| ) | const [virtual] |
Draws the graphical representation of data.
Draws the graphical representation of data in the given IlvPort dst using the transformer t and the clipping region clip. In the case of a composite displayer, the draw method is called for each child displayer that composes the composite displayer.
| dst | The port used for the drawing. | |
| t | The optional transformer. | |
| clip | The optional clipping region. |
Implements IlvAbstractChartDisplayer.
| virtual void IlvSingleChartDisplayer::drawDataPoint | ( | IlUInt | dataPtIdx, | |
| IlvPort * | dst, | |||
| const IlvTransformer * | t = 0, |
|||
| const IlvRegion * | clip = 0 | |||
| ) | const [virtual] |
Draws the graphical representation of the data point(s) at a given index.
Draws the graphical representation of the data point(s) at the index dataPtIdx in the data set(s) to be displayed by the current displayer. The drawing is performed in the port dst using the transformer t, and the clipping region clip.
| dataPtIdx | The index of the data point(s) to draw. | |
| dst | The port used for the drawing. | |
| t | The optional transformer. | |
| clip | The optional clipping region. |
Implements IlvAbstractChartDisplayer.
| virtual void IlvSingleChartDisplayer::drawDataPoints | ( | IlUInt | iMin, | |
| IlUInt | iMax, | |||
| IlvPort * | dst, | |||
| const IlvTransformer * | t = 0, |
|||
| const IlvRegion * | clip = 0 | |||
| ) | const [virtual] |
Draws the graphical representation of the data points between a given interval.
Draws the graphical representation of the data points between the indexes iMin and iMax in the data set(s) to be displayed by the current displayer. The drawing is performed in the port dst using the transformer t and the clipping region clip.
| iMin | The minimum index used to select the data points to draw. | |
| iMax | The maximum index used to select the data points to draw. | |
| dst | The port used for the drawing. | |
| t | The optional transformer. | |
| clip | The optional clipping region. |
1 and iMax is increased by 1 before selecting the data points whenever possible. This ensures continuity when drawing the chart, especially when polylines are used.IlvAbstractChartDisplayer::drawDataPoint method, which works for all cases. Implements IlvAbstractChartDisplayer.
| virtual void IlvSingleChartDisplayer::drawFill | ( | IlBoolean | b | ) | [virtual] |
Sets the filling mode of the displayer.
This method tells the displayer whether the shape to render must be filled (using the background color of the palette) or simply outlined. In the case of a composite displayer, the new mode is propagated to all the child displayers.
| b | The new value of the Boolean indicating if the shape is to be filled (IlTrue) or only outlined (IlFalse). |
Implements IlvAbstractChartDisplayer.
| virtual void IlvSingleChartDisplayer::drawItem | ( | const IlvChartDisplayerPoints * | displayerPoints, | |
| IlUInt | pointIndex, | |||
| IlUInt | pointsCount, | |||
| IlvPoint * | points, | |||
| IlvPalette * | itemPalette, | |||
| IlvPort * | dst, | |||
| const IlvTransformer * | t = 0, |
|||
| const IlvRegion * | clip = 0 | |||
| ) | const [protected, pure virtual] |
Draws the item for a given point in screen coordinates corresponding to a data point to display.
The item that is drawn for a given screen point corresponding to a data point to display depends on the type of the displayer. For example, for a displayer that displays data with 3D bars, the item is a 3D bar extending from this screen point to the abscissa scale.
The drawing is performed in the port dst using the transformer t and the clipping region clip.
IlvSingleChartDisplayer::computeItem method. (See this method for more details.)| displayerPoints | The object that stores the points in screen coordinates that have to be displayed by the current displayer. | |
| pointIndex | The index of the point in screen coordinates corresponding to a data point to display for which we want to draw the corresponding item. | |
| pointsCount | The number of points defining the item to draw. | |
| points | The points defining the item to draw. | |
| itemPalette | The palette used to draw the item. | |
| dst | The port used for the drawing. | |
| t | The optional transformer. | |
| clip | The optional clipping region. |
Implemented in IlvBarChartDisplayer, Ilv3dBarChartDisplayer, IlvBubbleChartDisplayer, IlvHiLoChartDisplayer, IlvHiLoBarChartDisplayer, IlvPieChartDisplayer, IlvPolylineChartDisplayer, IlvPolygonChartDisplayer, IlvStepChartDisplayer, IlvFixedStepChartDisplayer, IlvStairChartDisplayer, and IlvScatterChartDisplayer.
| virtual void IlvSingleChartDisplayer::drawLegendItem | ( | IlvPort * | dst, | |
| const IlvRect & | legendArea, | |||
| IlvPalette * | itemPal, | |||
| const IlvRegion * | clip, | |||
| IlAny | clientData = 0 | |||
| ) | const [virtual] |
Draws the graphic part of a legend item associated with the current displayer.
The drawing is performed in the port dst using the clipping region clip. It is bounded by the rectangle legendArea.
The current implementation of the method simply draws a rectangle on the limits of legendArea with the foreground color of the palette defined for the current displayer and fills this rectangle with the background color of this palette.
| dst | The port used for the drawing. | |
| legendArea | The area where the drawing is performed. | |
| itemPal | The palette of the legend item associated with the current displayer. | |
| clip | The optional clipping region. | |
| clientData | The client data defined for the legend item associated with the current displayer. |
Implements IlvAbstractChartDisplayer.
Reimplemented in IlvBubbleChartDisplayer, IlvHiLoChartDisplayer, IlvHiLoBarChartDisplayer, IlvPieChartDisplayer, IlvPolylineChartDisplayer, IlvPolygonChartDisplayer, IlvStepChartDisplayer, IlvFixedStepChartDisplayer, IlvStairChartDisplayer, and IlvScatterChartDisplayer.
| void IlvSingleChartDisplayer::drawPart | ( | const IlvCoordInterval & | abscissaRange, | |
| IlBoolean | shiftOfCycleLength, | |||
| IlvPort * | dst, | |||
| const IlvTransformer * | t = 0, |
|||
| const IlvRegion * | clip = 0 | |||
| ) | const [protected] |
Draws a part of the graphical representation of data.
Draws the graphical representation of the data that are within the abscissa interval defined by abscissaRange. The Boolean shiftOfCycleLength indicates whether the data must be shifted by the cycle length before being displayed. The drawing is performed in the given port dst using the transformer t and the clipping region clip.
| abscissaRange | The abscissa interval used to select the data to display. | |
| shiftOfCycleLength | A Boolean value indicating whether the data must be shifted by the cycle length before being displayed. | |
| dst | The port used for the drawing. | |
| t | The optional transformer. | |
| clip | The optional clipping region. |
IlvSingleChartDisplayer::draw method to draw the graphical representation by parts. If the chart that uses the current displayer to display data is in a cyclic mode (see the IlvChartGraphic::isInCyclicMode method), the graphical representation is displayed in two parts. One part displays data without shifting the data by the cycle length. The other part displays the data by shifting the data by the cycle length. (See the IlvCoordinateInfo::getFirstCycleRange and IlvCoordinateInfo::getSecondCycleRange methods for more details.) Otherwise, the graphical representation is displayed in one part. | virtual void IlvSingleChartDisplayer::drawPointInfos | ( | const IlvChartDisplayerPoints * | displayerPoints, | |
| IlvPort * | dst, | |||
| const IlvTransformer * | t = 0, |
|||
| const IlvRegion * | clip = 0, |
|||
| const IlvChartDataSet * | dataSet = 0 | |||
| ) | const [protected, virtual] |
Draws the point information defined for the data points to be displayed.
Draws the point information defined for the data points to be displayed by the current displayer, using the points expressed in screen coordinates that correspond to these data points. The drawing is performed in the given port dst using the transformer t and the clipping region clip by calling the IlvChartDataPointInfo::draw method on all the point information defined for the data points to display.
| displayerPoints | The object that stores the points in screen coordinates that have to be displayed by the current displayer. These points are considered to be already transformed by t. | |
| dst | The port used for the drawing. | |
| t | The optional transformer. | |
| clip | The optional clipping region. | |
| dataSet | The data set associated with the projected data points. If this parameter is set to 0, the first data set of the current displayer is considered. |
| virtual void IlvSingleChartDisplayer::drawPoints | ( | IlvChartDisplayerPoints * | displayerPoints, | |
| IlvPort * | dst, | |||
| const IlvTransformer * | t = 0, |
|||
| const IlvRegion * | clip = 0 | |||
| ) | const [protected, virtual] |
Draws the graphical representation from points in screen coordinates corresponding to the data points to display.
The drawing is performed in the given port dst using the transformer t and the clipping region clip.
The default implementation of this method uses the IlvSingleChartDisplayer::getClipArea method to obtain the clipping region to be used for the drawing. Then, for each point in screen coordinates stored in displayerPoints, it uses:
IlvSingleChartDisplayer::computeItem method to compute the item that will be displayed for this screen point. IlvSingleChartDisplayer::drawItem method to draw the item for this screen point. At the end, it uses the IlvSingleChartDisplayer::drawPointInfos method to draw the point information (if any).
| displayerPoints | The object that stores the points in screen coordinates that have to be displayed by the current displayer. These points are considered to be already transformed by t. | |
| dst | The port used for the drawing. | |
| t | The optional transformer. | |
| clip | The optional clipping region. |
Reimplemented in Ilv3dBarChartDisplayer, IlvBubbleChartDisplayer, IlvHiLoChartDisplayer, IlvPieChartDisplayer, IlvPolylineChartDisplayer, IlvPolygonChartDisplayer, and IlvStairChartDisplayer.
Returns the background color of a palette used by the current displayer to display data.
If the current displayer is a single displayer (that is, an object inherited from the IlvSingleChartDisplayer class), this method just returns the background color of the palette stored inside the displayer. If the current displayer is a composite displayer (that is, an object inherited from the IlvCompositeChartDisplayer class), this method returns the background color of the palette used by the displayer at the index index in the collection of displayers that compose the current displayer.
| index | If the current displayer is a composite displayer, this parameter indicates the index of the displayer within the displayers that compose the current displayer. Otherwise, this parameter can be omitted. |
Implements IlvAbstractChartDisplayer.
| virtual void IlvSingleChartDisplayer::getClipArea | ( | IlvRect & | area, | |
| const IlvTransformer * | t | |||
| ) | const [virtual] |
Returns the clipping region that is used for the drawing.
The current implementation of the method returns in area the area obtained by the IlvSingleChartDisplayer::getDataDisplayArea method expanded along the base by the shift offset if it is different from 0 (obtained by the IlvSingleChartDisplayer::getShiftOffset method). The term base of a chart refers to the abscissa scale of this chart.
| area | The clipping region that is used to clip the graphical representation of data drawn by the current displayer. | |
| t | The transformer that is applied to the returned clipping region. |
Implements IlvAbstractChartDisplayer.
Reimplemented in IlvBarChartDisplayer, Ilv3dBarChartDisplayer, IlvBubbleChartDisplayer, IlvHiLoChartDisplayer, IlvPieChartDisplayer, IlvFixedStepChartDisplayer, and IlvScatterChartDisplayer.
| void IlvSingleChartDisplayer::getDataDisplayArea | ( | IlvRect & | dataDisplayArea, | |
| const IlvTransformer * | t = 0 | |||
| ) | const |
Returns the bounds of the data display area.
Returns in dataDisplayArea the maximum area where data can be displayed by the current displayer. This area is referred to as the data display area. It determines the limits outside of which the current displayer cannot display data.
| dataDisplayArea | The returned data display area. | |
| t | The transformer that is applied to the returned data display area. |
| IlvChartDisplayerPointsFactory* IlvSingleChartDisplayer::getDisplayerPointsFactory | ( | ) | const |
Returns the factory used to create IlvChartDisplayerPoints instances.
setDisplayerPointsFactory. | virtual IlUInt IlvSingleChartDisplayer::getDisplayersCount | ( | ) | const [virtual] |
| virtual IlUInt IlvSingleChartDisplayer::getDisplayItem | ( | IlvChartDataSet *& | dataSet, | |
| const IlvPoint & | viewPoint, | |||
| const IlvTransformer * | t | |||
| ) | const [virtual] |
Returns the item to which a view point corresponds.
Returns the index of the data point in the data set dataSet displayed by the current displayer that has its corresponding representation colliding with the point viewPoint. The returned index is equal to IlvBadIndex if no data point has been found. If the data set dataSet passed as a parameter is equal to 0, the nearest data point is searched for in all the data sets displayed by the current displayer. Otherwise, it is searched for in the data set dataSet. At the end, dataSet references the data set in which the data point has been found or 0 if no data set has been found. If no point has been found in a data set, dataSet is also equal to 0.
| dataSet | The data set from which a data point is retrieved. | |
| viewPoint | The point in screen coordinates for which we want to get the nearest displayed data point. | |
| point | The screen point corresponding to the nearest data point that has been found. | |
| t | The optional transformer. |
Implements IlvAbstractChartDisplayer.
| virtual IlBoolean IlvSingleChartDisplayer::getDisplayPoint | ( | const IlvChartDataSet * | dataSet, | |
| IlUInt | dataPtIdx, | |||
| IlvPoint & | point, | |||
| const IlvTransformer * | t = 0 | |||
| ) | const [virtual] |
Returns the corresponding screen point for a data point.
Returns in point the point in screen coordinates corresponding to the data point at the index dataPtIdx in the data set data set to be displayed by the current displayer.
| dataSet | The data set to which the considered data point belongs. | |
| dataPtIdx | The index of the considered data point in the data set dataSet. | |
| point | The screen point corresponding to the considered data point. | |
| t | The transformer that is applied to the returned screen point. |
IlTrue if the corresponding screen point has been successfully computed and IlFalse otherwise. Implements IlvAbstractChartDisplayer.
Returns the foreground color of a palette used by the current displayer to display data.
If the current displayer is a single displayer (that is, an object inherited from the IlvSingleChartDisplayer class), this method just returns the foreground color of the palette stored inside the displayer. If the current displayer is a composite displayer (that is, an object inherited from the IlvCompositeChartDisplayer class), this method returns the foreground color of the palette used by the displayer at the index index in the collection of displayers that compose the current displayer.
| index | If the current displayer is a composite displayer, this parameter indicates the index of the displayer within the displayers that compose the current displayer. Otherwise, this parameter can be omitted. |
Implements IlvAbstractChartDisplayer.
| virtual const char* IlvSingleChartDisplayer::getInternalLegendText | ( | IlUInt | index = 0 |
) | const [virtual] |
Returns the legend text stored in the current displayer.
This text, if it is defined, is used in a legend as comments for the data represented by the current displayer. (See the IlvAbstractChartDisplayer::getLegendText method.) If the current displayer is a single displayer (that is, an object inherited from the IlvSingleChartDisplayer class), this method just returns the legend text stored inside the displayer. If the current displayer is a composite displayer (that is, an object inherited from the IlvCompositeChartDisplayer class), this method returns the legend text stored for the displayer at the index index in the collection of displayers that compose the current displayer.
| index | If the current displayer is a composite displayer, this parameter indicates the index of the displayer within the displayers that compose the current displayer. Otherwise, this parameter can be omitted. |
Implements IlvAbstractChartDisplayer.
| virtual IlUInt IlvSingleChartDisplayer::getItemPointsCount | ( | const IlvChartDisplayerPoints * | displayerPoints | ) | const [protected, virtual] |
Returns the maximum number of points needed to define an item for the current displayer.
(See the IlvSingleChartDisplayer::computeItem method for more details.)
| displayerPoints | The object that stores the points in screen coordinates that have to be displayed by the current displayer. |
Reimplemented in IlvBarChartDisplayer, Ilv3dBarChartDisplayer, IlvBubbleChartDisplayer, IlvHiLoChartDisplayer, IlvHiLoBarChartDisplayer, IlvPieChartDisplayer, IlvPolylineChartDisplayer, IlvStepChartDisplayer, IlvFixedStepChartDisplayer, IlvStairChartDisplayer, and IlvScatterChartDisplayer.
| virtual const char* IlvSingleChartDisplayer::getLegendText | ( | IlUInt | index = 0 |
) | const [virtual] |
Returns the text that will be used in a legend for the current displayer.
If the current displayer is a single displayer (that is, an object inherited from the IlvSingleChartDisplayer class), this method just returns the legend text stored inside the displayer if it is defined. Otherwise, the method returns the name of the data set obtained by the IlvAbstractChartDisplayer::getRealDataSet method. If the current displayer is a composite displayer (that is, an object inherited from the IlvCompositeChartDisplayer class), this method returns the text that will be used in a legend for the displayer at the index index in the collection of displayers that compose the current displayer.
| index | If the current displayer is a composite displayer, this parameter indicates the index of the displayer within the displayers that compose the current displayer. Otherwise, this parameter can be omitted. |
Implements IlvAbstractChartDisplayer.
Reimplemented in IlvHiLoChartDisplayer.
| virtual IlUInt IlvSingleChartDisplayer::getNearestPoint | ( | IlvChartDataSet *& | dataSet, | |
| const IlvPoint & | viewPoint, | |||
| IlvDim | distance, | |||
| IlvPoint & | point, | |||
| const IlvTransformer * | t = 0 | |||
| ) | const [virtual] |
Returns the nearest data point.
Returns the index of the data point in the data set dataSet displayed by the current displayer that has its corresponding point in screen coordinates nearest to the point viewPoint. The returned index is equal to IlvBadIndex if no data point has been found. If the data set dataSet passed as a parameter is equal to 0, the nearest data point is searched for in all the data sets displayed by the current displayer. Otherwise, it is searched for in the data set dataSet. At the end, dataSet references the data set in which the data point has been found or 0 if no data set has been found. If no point has been found in a data set, dataSet is also equal to 0.
| dataSet | The data set from which a data point is retrieved. | |
| viewPoint | The point in screen coordinates for which we want to get the nearest displayed data point. | |
| distance | The maximum distance allowed between viewPoint and the screen point corresponding to the returned data point. | |
| point | The screen point corresponding to the nearest data point that has been found. | |
| t | The optional transformer. |
Implements IlvAbstractChartDisplayer.
| IlUInt IlvSingleChartDisplayer::getNearestPointInsidePart | ( | const IlvCoordInterval & | abscissaRange, | |
| IlBoolean | shiftOfCycleLength, | |||
| IlvChartDataSet *& | dataSet, | |||
| const IlvPoint & | viewPoint, | |||
| IlvDim | distance, | |||
| IlvPoint & | point, | |||
| const IlvTransformer * | t = 0 | |||
| ) | const [protected] |
Returns the nearest data point within a given abscissa range.
Returns the index of the data point in the data set dataSet displayed by the current displayer that has its corresponding point in screen coordinates nearest the point viewPoint. The data point is searched for only within the abscissa interval defined by abscissaRange.
The returned index is equal to IlvBadIndex if no data point has been found. If the data set dataSet passed as a parameter is equal to 0, the nearest data point is searched for in all the data sets displayed by the current displayer. Otherwise, it is searched for in the data set dataSet.
At the end, dataSet references the data set in which the data point has been found or 0 if no data set has been found. If no point has been found in a data set, dataSet is also equal to 0.
| abscissaRange | The abscissa interval that is considered in order to find the nearest data point. | |
| shiftOfCycleLength | A Boolean value indicating whether the data have been shifted by the cycle length before being displayed. | |
| dataSet | The data set in which we get a data point. | |
| viewPoint | The point in screen coordinates for which we want to get the nearest displayed data point. | |
| distance | The maximum distance allowed between viewPoint and the screen point corresponding to the returned data point. | |
| point | The screen point corresponding to the nearest data point that has been found. | |
| t | The optional transformer. |
IlvSingleChartDisplayer::getNearestPoint method. Since the graphical representation is drawn by parts (see the IlvSingleChartDisplayer::drawPart method), the search for the nearest data point of a given screen point is also performed by parts. Two parts are considered if the chart that uses the current displayer to display data is in cyclic mode (see the IlvChartGraphic::isInCyclicMode method). One part is for data that have not been shifted by the cycle length before being displayed and the other part is for data that have been shifted by the cycle length before being displayed. (See the IlvCoordinateInfo::getFirstCycleRange and IlvCoordinateInfo::getSecondCycleRange methods for more details). Otherwise, only one part is considered. | virtual IlvPalette* IlvSingleChartDisplayer::getPalette | ( | IlUInt | index = 0 |
) | const [virtual] |
Returns a palette used by the current displayer to display data.
If the current displayer is a single displayer (that is, an object inherited from the IlvSingleChartDisplayer class), this method just returns the palette stored inside the displayer. If the current displayer is a composite displayer (that is, an object inherited from the IlvCompositeChartDisplayer class), this method returns the palette used by the displayer at the index index in the collection of displayers that compose the current displayer.
| index | If the current displayer is a composite displayer, this parameter indicates the index of the displayer within the displayers composing the current displayer. Otherwise, this parameter can be omitted. |
Implements IlvAbstractChartDisplayer.
| virtual IlvPointInfoCollection* IlvSingleChartDisplayer::getPointInfoCollection | ( | const IlvChartDataSet * | dataSet | ) | const [virtual] |
Returns the point information collection defined to be used to display a given data set.
| dataSet | The data set that will be displayed by the current displayer. |
Implements IlvAbstractChartDisplayer.
| IlvPos IlvSingleChartDisplayer::getShiftOffset | ( | ) | const |
Returns the offset by which the graphical representation of data is shifted along the base of the chart.
The term base of a chart refers to the abscissa scale of this chart. By default, the shift offset is equal to 0. This offset is useful when displaying side-by-side charts in which the graphical representations are shifted along the abscissa.
| virtual IlvDim IlvSingleChartDisplayer::getSizeAlongBase | ( | ) | const [virtual] |
Returns the size along the base for the graphical representation of a given data point.
The term base of a chart refers to the abscissa scale of this chart. This size is useful for displaying side-by-side charts. It is used to indicate the offset by which the graphical representation for a data point must be shifted so it can be drawn next to the graphical representation for another data point. For example, for a bar displayer, the size along the base corresponds to the width of a bar.
0 by default. Reimplemented in IlvBarChartDisplayer, IlvBubbleChartDisplayer, IlvHiLoChartDisplayer, IlvFixedStepChartDisplayer, and IlvScatterChartDisplayer.
| IlBoolean IlvSingleChartDisplayer::isDrawingFill | ( | ) | const |
Returns the filling mode for the current displayer.
See the IlvAbstractChartDisplayer::drawFill method for more details.
IlTrue if the shape of the graphical representation of data is displayed filled and IlFalse otherwise. | virtual void IlvSingleChartDisplayer::releaseDisplayerPoints | ( | IlvChartDisplayerPoints * | dispPts | ) | const [virtual] |
Releases an IlvChartDisplayerPoints object used by the current displayer.
Releases the IlvChartDisplayerPoints object dispPts when it is no more used by the current displayer. If a factory is associated with the current displayer, the IlvChartDisplayerPointsFactory::release method is used. If no factory is defined, the delete operator is called on dispPts.
| dispPts | An IlvChartDisplayerPoints object that is used by the current displayer. |
allocDisplayerPoints. | virtual IlvDoublePoint* IlvSingleChartDisplayer::selectDataPointsForPoint | ( | IlUInt | dataPtIdx, | |
| IlUInt & | count, | |||
| IlUInt *& | dataPtIdxes | |||
| ) | const [protected, virtual] |
Selects and returns the data points needed to be able to display the graphical representation of the data point(s) at a given index in the real data set(s) to be displayed by the current displayer.
For example, for a displayer displaying a data set with a polyline, to be able to draw the graphical representation for a data point at a given index of the data set, we must select the data point at this index plus the data point at the index before (if it exists) and the data point at the index after (if it exists). The data points thus selected will allow the part of the polyline passing through the considered data point at a given index to be drawn.
The current implementation of this method simply returns the data point at the index dataPtIdx and stores this index in the array dataPtIdxes.
| dataPtIdx | The index of the data point(s) for which we want to select the data points that are needed to draw the graphical representation for the data point(s) at this index. | |
| count | The number of selected data points. | |
| dataPtIdxes | An array of the indexes of the selected data points. |
Reimplemented in IlvHiLoChartDisplayer, IlvPieChartDisplayer, IlvPolylineChartDisplayer, IlvPolygonChartDisplayer, and IlvStepChartDisplayer.
| virtual IlvDoublePoint* IlvSingleChartDisplayer::selectDataPointsForRange | ( | const IlvCoordInterval & | abscissaRange, | |
| IlUInt & | pointCount, | |||
| IlUInt *& | dataPtIdxes, | |||
| const IlvTransformer * | t = 0, |
|||
| const IlvRect * | clip = 0 | |||
| ) | const [protected, virtual] |
Selects And returns the data points to display that are within a given abscissa interval.
The current implementation of the method takes the clipping region clip into account to select from the data points that are within abscissaRange only those that are needed to draw inside the clipping region.
| abscissaRange | The abscissa interval used to select the data points. | |
| pointCount | The number of selected data points. | |
| dataPtIdxes | An array of the indexes of the selected data points. | |
| t | The transformer (if any) that is used for drawing the data points by the current displayer. | |
| clip | The clipping region (if any) that is used for drawing the data points by the current displayer. |
Reimplemented in IlvPieChartDisplayer.
| virtual IlvDoublePoint* IlvSingleChartDisplayer::selectDataPointsInRect | ( | IlUInt & | pointCount, | |
| IlUInt *& | dataPtIdxes, | |||
| IlvRect | pickRect, | |||
| const IlvTransformer * | t = 0 | |||
| ) | const [protected, virtual] |
Selects the data points of dataSet that are rendered within pickRect.
| pointCount | Contains the number of points on return. |
| virtual void IlvSingleChartDisplayer::setBackground | ( | IlvColor * | color, | |
| IlUInt | index = 0 | |||
| ) | [virtual] |
Sets the background color of a palette used by the current displayer to display data.
If the current displayer is a single displayer (that is, an object inherited from the IlvSingleChartDisplayer class), this method just sets the background color of the palette stored inside the displayer. If the current displayer is a composite displayer (that is, an object inherited from the IlvCompositeChartDisplayer class), this method sets the background color of the palette used by the displayer at the index index in the collection of displayers that compose the current displayer.
| color | The background color to be set. | |
| index | If the current displayer is a composite displayer, this parameter indicates the index of the displayer within the displayers that compose the current displayer. Otherwise, this parameter can be omitted. |
Implements IlvAbstractChartDisplayer.
| virtual IlBoolean IlvSingleChartDisplayer::setDataPoint | ( | IlvChartDataSet * | dataSet, | |
| IlUInt | dataPtIdx, | |||
| const IlvPoint & | point, | |||
| const IlvTransformer * | t = 0 | |||
| ) | const [virtual] |
Sets the corresponding data point from a screen point.
Computes from the point in screen coordinates point the corresponding data point and sets this data point at the index dataPtIdx in the data set dataSet that is displayed by the current displayer.
| dataSet | The data set for which we want to set a data point. | |
| dataPtIdx | The index of the data point to be set. | |
| point | The point in screen coordinates that is considered to be already transformed by t. | |
| t | The transformer that has already been applied to point. |
IlTrue if the data point has been successfully set and IlFalse otherwise. Implements IlvAbstractChartDisplayer.
| IlvChartDisplayerPointsFactory* IlvSingleChartDisplayer::setDisplayerPointsFactory | ( | IlvChartDisplayerPointsFactory * | factory | ) |
Sets the factory used to create IlvChartDisplayerPoints instances.
The factory is used by the IlvSingleChartDisplayer::allocDisplayerPoints and IlvSingleChartDisplayer::releaseDisplayerPoints methods.
| factory | The new factory. |
getDisplayerPointsFactory. | virtual void IlvSingleChartDisplayer::setForeground | ( | IlvColor * | color, | |
| IlUInt | index = 0 | |||
| ) | [virtual] |
Sets the foreground color of a palette used by the current displayer to display data.
If the current displayer is a single displayer (that is, an object inherited from the IlvSingleChartDisplayer class), this method just sets the foreground color of the palette stored inside the displayer. If the current displayer is a composite displayer (that is, an object inherited from the IlvCompositeChartDisplayer class), this method sets the foreground color of the palette used by the displayer at the index index in the collection of displayers that compose the current displayer.
| color | The foreground color to be set. | |
| index | If the current displayer is a composite displayer, this parameter indicates the index of the displayer within the displayers that compose the current displayer. Otherwise, this parameter can be omitted. |
Implements IlvAbstractChartDisplayer.
| virtual void IlvSingleChartDisplayer::setLegendItems | ( | IlvChartLegend * | legend | ) | const [virtual] |
Sets the legend items associated with the current displayer.
Sets the legend items associated with the current displayer on the legend legend.
The current implementation simply calls the IlvChartLegend::addLegendItem method one time if the current displayer can be viewed (see the IlvAbstractChartDisplayer::isViewable method).
See the IlvAbstractChartDisplayer::setLegendItems method for more details.
| legend | The legend that will display the legend items associated with the current displayer. |
Implements IlvAbstractChartDisplayer.
Reimplemented in IlvPieChartDisplayer.
| virtual void IlvSingleChartDisplayer::setLegendText | ( | const char * | text, | |
| IlUInt | index = 0 | |||
| ) | [virtual] |
Sets the text that will be used in a legend for the current displayer.
If the current displayer is a single displayer (that is, an object inherited from the IlvSingleChartDisplayer class), this method just sets the legend text stored inside the displayer. If the current displayer is a composite displayer (that is, an object inherited from the IlvCompositeChartDisplayer class), this method sets the legend text defined for the displayer at the index index in the collection of displayers that compose the current displayer.
| text | The text that will be used in a legend for the current displayer. The text passed as a parameter is copied. | |
| index | If the current displayer is a composite displayer, this parameter indicates the index of the displayer within the displayers that compose the current displayer. Otherwise, this parameter can be omitted. |
Implements IlvAbstractChartDisplayer.
| virtual void IlvSingleChartDisplayer::setMode | ( | IlvDrawMode | mode | ) | [virtual] |
Sets the drawing mode.
Sets the drawing mode for the current object. The information is passed to all the palettes used by the current displayer to display data.
| mode | The new drawing mode for the current object. |
Implements IlvAbstractChartDisplayer.
Reimplemented in Ilv3dBarChartDisplayer, IlvHiLoChartDisplayer, and IlvPieChartDisplayer.
| virtual void IlvSingleChartDisplayer::setOverwrite | ( | IlBoolean | o | ) | [virtual] |
Sets the overwrite mode.
Modifies the way the drawing member functions of the current object operate when drawing on the root port. If the o parameter is set to IlFalse, the drawing operations are hidden by the windows stored on the top window. If the parameter is set to IlTrue, the drawing operations are performed on top of every window present on the screen, just as if the windows were part of the root window. The information is passed to all the palettes used by the current displayer to display data.
| o | The new value of the Boolean indicating the way the drawing member functions operate. |
Implements IlvAbstractChartDisplayer.
Reimplemented in Ilv3dBarChartDisplayer, IlvHiLoChartDisplayer, and IlvPieChartDisplayer.
| virtual void IlvSingleChartDisplayer::setPalette | ( | IlvPalette * | pal, | |
| IlUInt | index = 0 | |||
| ) | [virtual] |
Sets a palette used by the current displayer to display data.
If the current displayer is a single displayer (that is, an object inherited from the IlvSingleChartDisplayer class), this method just sets the palette stored inside the displayer. If the current displayer is a composite displayer (that is, an object inherited from the IlvCompositeChartDisplayer class), this method sets the palette used by the displayer at the index index in the collection of displayers that compose the current displayer.
| pal | The palette to be set. | |
| index | If the current displayer is a composite displayer, this parameter indicates the index of the displayer within the displayers composing the current displayer. Otherwise, this parameter can be omitted. |
Implements IlvAbstractChartDisplayer.
Reimplemented in Ilv3dBarChartDisplayer.
| virtual void IlvSingleChartDisplayer::setPointInfoCollection | ( | const IlvChartDataSet * | dataSet, | |
| IlvPointInfoCollection * | ptInfoCollection | |||
| ) | [virtual] |
Sets the point information collection that will be used to display a given data set.
This new point information collection has priority. It is the one that will be considered to display the data set dataSet, even if a point information collection has already been defined for the data set dataSet by using the IlvChartDataSet::setPointInfoCollection method.
| dataSet | The data set that will be displayed by the current displayer. | |
| ptInfoCollection | The point information collection that will be used to display the data set dataSet. |
Implements IlvAbstractChartDisplayer.
| void IlvSingleChartDisplayer::setShiftOffset | ( | IlvPos | offset | ) |
Sets the offset by which the graphical representation of data is shifted along the base of the chart.
The term base of a chart refers to the abscissa scale of this chart.
| offset | The new offset used to shift the graphical representation of data displayed by the current displayer. |
0. This offset is used by the side-by-side displayers to draw graphical representations that are shifted along the abscissa. In this case, an appropriate shift offset is automatically set in the IlvSideBySideChartDisplayer::updateDisplayers method and, therefore, does not need to be set by hand. | virtual void IlvSingleChartDisplayer::treatPointsOutOfAbscissaLimits | ( | const IlvRect & | dataDisplayArea, | |
| IlvChartDisplayerPoints * | displayerPoints, | |||
| const IlvCoordInterval & | abscissaRange, | |||
| const IlvPoint & | minLimit, | |||
| const IlvPoint & | maxLimit | |||
| ) | const [virtual] |
Treats the occurrence of points in screen coordinates that are outside the abscissa limits.
The current implementation of the method simply removes the screen points stored in displayerPoints that are outside the abscissa limits. This means that they are before the minimum value considered for the abscissa or after the maximum value considered for the ordinate.
| dataDisplayArea | The data display area used by the current displayer. | |
| displayerPoints | The object that stores the points in screen coordinates that have to be displayed by the current displayer. | |
| abscissaRange | The interval of values that is considered for the abscissa. | |
| minLimit | The point on the abscissa scale that corresponds to the minimum value that is considered for the abscissa. | |
| maxLimit | The point on the abscissa scale that corresponds to the maximum value that is considered for the abscissa. |
Reimplemented in IlvPolylineChartDisplayer, and IlvStepChartDisplayer.
| virtual IlBoolean IlvSingleChartDisplayer::usePointInfo | ( | ) | const [virtual] |
Indicates whether point information collections are defined.
IlTrue if at least one point information collection is defined for one of the real data sets to be displayed by the current displayer (either the point information collection is defined only to be used by the current displayer or it has been set directly on the data set). Otherwise, it returns IlFalse. | virtual void IlvSingleChartDisplayer::write | ( | IlvOutputFile & | file | ) | const [virtual] |
Writes the attributes of the current object in a file.
Called by the IlvAbstractChartDisplayer::save method. This method can be overloaded in subclasses that define new attributes. The information written by the write method is read by the IO constructor, which takes an IlvInputFile as its only argument. Both this method and the IO constructor can be automatically declared by using the DeclareChartDisplayerTypeInfo macro within the class declaration.
| file | The file where the attributes of the current object are written. |
Reimplemented from IlvAbstractChartDisplayer.
Reimplemented in IlvPieChartDisplayer, IlvPolylineChartDisplayer, IlvFixedStepChartDisplayer, and IlvScatterChartDisplayer.
© Copyright 2012, Rogue Wave Software, Inc. All Rights Reserved.
Rogue Wave is a registered trademark of Rogue Wave Software, Inc. in the United States and other countries. All other trademarks are the property of their respective owners.

