
Rogue Wave Views 5.6
Rogue Wave Views
Charts Package API Reference Guide
Rogue Wave Views
Documentation Home
Rogue Wave Views 5.6 |
Rogue Wave Views |
Rogue Wave Views Documentation Home |
Class for bar displayers. More...
#include <ilviews/charts/bar.h>
Public Member Functions | |
| IlvBarChartDisplayer (IlvDim width=IlvChartDisplayerWidth, IlvPalette *palette=0) | |
| Constructor. | |
| virtual void | getClipArea (IlvRect &area, const IlvTransformer *t) const |
| Returns the clipping region that is used for the drawing. | |
| IlvDim | getSize () const |
| Returns the size of the bars used to represent the data. | |
| virtual IlvDim | getSizeAlongBase () const |
| Returns the size along the base for the graphical representation of a given data point. | |
| IlUInt | getStrokeThreshold () const |
| Returns the minimum width of a bar, below which the stroke of a rendering style is not used. | |
| virtual IlvDim | getWidth () const |
| Returns the width of the bars used to represent the data. | |
| IlUInt | getWidthPercent () const |
| Returns the width percentage of the bars used to represent the data. | |
| virtual IlBoolean | isFilled () const |
| Indicates whether the graphical representation is filled. | |
| void | setStrokeThreshold (IlUInt threshold) |
| Specifies the minimum width of a bar, below which the stroke of a rendering style is not used. | |
| virtual void | setWidth (IlvDim width) |
| Sets the width of the bars used to represent the data. | |
| void | setWidthPercent (IlUInt width) |
| Sets the width percentage of the space between two bars. | |
Protected Member Functions | |
| virtual void | boundingBoxOfPoints (IlvChartDisplayerPoints *displayerPoints, IlvRect &bbox, IlBoolean takeInfoIntoAccount, const IlvTransformer *t=0) const |
| Computes the bounding box of the graphical representation from points in screen coordinates corresponding to the data points to display. | |
| virtual void | computeItem (const IlvChartDisplayerPoints *displayerPoints, IlUInt pointIndex, IlUInt &usedPointsCount, IlvPoint *points, const IlvTransformer *t=0) const |
| Computes the item that will be displayed for a given point in screen coordinates corresponding to a data point to display. | |
| virtual void | drawItem (const IlvChartDisplayerPoints *displayerPoints, IlUInt pointIndex, IlUInt pointCount, IlvPoint *points, IlvPalette *itemPalette, IlvPort *dst, const IlvTransformer *t=0, const IlvRegion *clip=0) const |
| Draws the item for a given point in screen coordinates corresponding to a data point to display. | |
| virtual IlUInt | getItemPointsCount (const IlvChartDisplayerPoints *displayerPoints) const |
| Returns the maximum number of points needed to define an item for the current displayer. | |
Class for bar displayers.
Library: ilvcharts
This class is a subclass of IlvSingleChartDisplayer which allows you to represent data with bars.
The bar displayer displays a unique data set. This displayer can be used with any type of projection (see the IlvAbstractProjector class for more details).
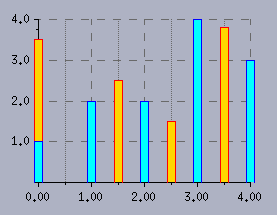
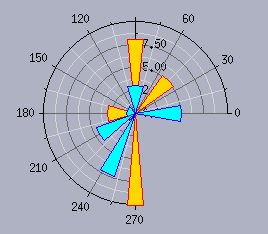
The images below show data sets represented with bar displayers in a Cartesian chart (on the left) and a polar chart (on the right).
IlvSingleChartDisplayer. | IlvBarChartDisplayer::IlvBarChartDisplayer | ( | IlvDim | width = IlvChartDisplayerWidth, |
|
| IlvPalette * | palette = 0 | |||
| ) |
Constructor.
Initializes a new IlvBarChartDisplayer object.
| width | The width of the bars that will be used to represent the data. | |
| palette | The palette that will be used to display the bars. |
| virtual void IlvBarChartDisplayer::boundingBoxOfPoints | ( | IlvChartDisplayerPoints * | displayerPoints, | |
| IlvRect & | bbox, | |||
| IlBoolean | takeInfoIntoAccount, | |||
| const IlvTransformer * | t = 0 | |||
| ) | const [protected, virtual] |
Computes the bounding box of the graphical representation from points in screen coordinates corresponding to the data points to display.
See the IlvSingleChartDisplayer::boundingBoxOfPoints method for more details.
This method calls the IlvSingleChartDisplayer::boundingBoxOfPoints method, then enlarges the computed bounding box by extending it to the origin (see the IlvBarChartDisplayer::isFilled method for more information), and finally expands it by half the width of the bars.
Reimplemented from IlvSingleChartDisplayer.
Reimplemented in Ilv3dBarChartDisplayer.
| virtual void IlvBarChartDisplayer::computeItem | ( | const IlvChartDisplayerPoints * | displayerPoints, | |
| IlUInt | pointIndex, | |||
| IlUInt & | usedPointsCount, | |||
| IlvPoint * | points, | |||
| const IlvTransformer * | t = 0 | |||
| ) | const [protected, virtual] |
Computes the item that will be displayed for a given point in screen coordinates corresponding to a data point to display.
Computes the points defining the item that will be displayed for the point in screen coordinates that is stored at the index pointIndex in the displayerPoints object. This object stores the points in screen coordinates corresponding to the data points that have to be displayed by the current displayer. (See the IlvSingleChartDisplayer::computeItem method for more details.)
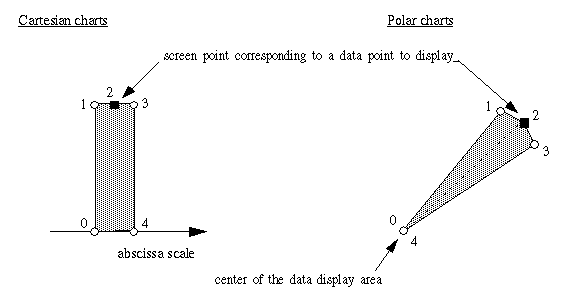
The item that will be displayed for a given screen point corresponding to a data point is a bar. This bar is defined by five points: four points corresponding to the corners of the bar and one screen point corresponding to the data point for which the item is displayed. The following figure shows these points. The indexes at which the points are stored in the array points that is used to return the points defining the item are displayed next to the points.
The number of computed points defining the item (that is, 5) is returned in usedPointsCount.
Implements IlvSingleChartDisplayer.
Reimplemented in Ilv3dBarChartDisplayer.
| virtual void IlvBarChartDisplayer::drawItem | ( | const IlvChartDisplayerPoints * | displayerPoints, | |
| IlUInt | pointIndex, | |||
| IlUInt | pointCount, | |||
| IlvPoint * | points, | |||
| IlvPalette * | itemPalette, | |||
| IlvPort * | dst, | |||
| const IlvTransformer * | t = 0, |
|||
| const IlvRegion * | clip = 0 | |||
| ) | const [protected, virtual] |
Draws the item for a given point in screen coordinates corresponding to a data point to display.
Draws the item for the point in screen coordinates that is stored at the index pointIndex in the displayerPoints object. This object stores the points in screen coordinates corresponding to the data points that have to be displayed by the current displayer. (See the IlvSingleChartDisplayer::drawItem method for more details.)
This method draws the bar defined by the points stored in points. A polyline is drawn between the first and the fifth point with the foreground color of the palette itemPalette. The bar is filled with the background color of the palette itemPalette if the method IlvSingleChartDisplayer::isDrawingFill returns IlTrue. (See the IlvBarChartDisplayer::computeItem method for more details.)
Implements IlvSingleChartDisplayer.
Reimplemented in Ilv3dBarChartDisplayer.
| virtual void IlvBarChartDisplayer::getClipArea | ( | IlvRect & | area, | |
| const IlvTransformer * | t | |||
| ) | const [virtual] |
Returns the clipping region that is used for the drawing.
This method returns in area the clipping region that is used to clip the graphical representation of data drawn by the current object. If a transformer t is specified, the returned clipping region is transformed by t. The current implementation of the method returns in area the area obtained by the IlvSingleChartDisplayer::getClipArea method expanded along the base by the size of a bar (obtained by the IlvBarChartDisplayer::getSize method). The term base of a chart refers to the abscissa scale of this chart.
| area | The returned clipping region that is used by the current object for the drawing. | |
| t | The transformer that is applied to the returned clipping region. |
Reimplemented from IlvSingleChartDisplayer.
Reimplemented in Ilv3dBarChartDisplayer.
| virtual IlUInt IlvBarChartDisplayer::getItemPointsCount | ( | const IlvChartDisplayerPoints * | displayerPoints | ) | const [protected, virtual] |
Returns the maximum number of points needed to define an item for the current displayer.
See the IlvBarChartDisplayer::computeItem method for more details.
| displayerPoints | The object that stores the points in screen coordinates to be displayed by the current displayer. |
5. Reimplemented from IlvSingleChartDisplayer.
Reimplemented in Ilv3dBarChartDisplayer.
| IlvDim IlvBarChartDisplayer::getSize | ( | ) | const |
Returns the size of the bars used to represent the data.
| virtual IlvDim IlvBarChartDisplayer::getSizeAlongBase | ( | ) | const [virtual] |
Returns the size along the base for the graphical representation of a given data point.
See the IlvSingleChartDisplayer::getSizeAlongBase method for more details.
IlvBarChartDisplayer::getSize method. Reimplemented from IlvSingleChartDisplayer.
| IlUInt IlvBarChartDisplayer::getStrokeThreshold | ( | ) | const |
Returns the minimum width of a bar, below which the stroke of a rendering style is not used.
The default value is 6.
| virtual IlvDim IlvBarChartDisplayer::getWidth | ( | ) | const [virtual] |
Returns the width of the bars used to represent the data.
Reimplemented in Ilv3dBarChartDisplayer.
| IlUInt IlvBarChartDisplayer::getWidthPercent | ( | ) | const |
Returns the width percentage of the bars used to represent the data.
| virtual IlBoolean IlvBarChartDisplayer::isFilled | ( | ) | const [virtual] |
Indicates whether the graphical representation is filled.
This method indicates whether the graphical representation is filled. A graphical representation is filled for a given data point if it is not only located around this data point but also if it extends towards the origin. This is the case for displayers representing data with bars. A bar begins at the data point position and is drawn to the abscissa scale in Cartesian charts and to the center of the data display area in polar charts.
IlTrue by default. Reimplemented from IlvAbstractChartDisplayer.
| void IlvBarChartDisplayer::setStrokeThreshold | ( | IlUInt | threshold | ) |
Specifies the minimum width of a bar, below which the stroke of a rendering style is not used.
| threshold | The new threshold in pixel. Bars with a width smaller than this threshold will not be rendered with a stroke, unless they are not filled. |
| virtual void IlvBarChartDisplayer::setWidth | ( | IlvDim | width | ) | [virtual] |
Sets the width of the bars used to represent the data.
| width | The new width of the bars used to represent the data. |
Reimplemented in Ilv3dBarChartDisplayer.
| void IlvBarChartDisplayer::setWidthPercent | ( | IlUInt | width | ) |
Sets the width percentage of the space between two bars.
The bars width will be computed as a percentage of the available space between two abscissa points. Therefore, the bars width will grow along if the chart is enlarged.
| width | The width percentage, between 0 and 100. |
© Copyright 2012, Rogue Wave Software, Inc. All Rights Reserved.
Rogue Wave is a registered trademark of Rogue Wave Software, Inc. in the United States and other countries. All other trademarks are the property of their respective owners.

