
Rogue Wave Views 5.6
Rogue Wave Views
Charts Package API Reference Guide
Rogue Wave Views
Documentation Home
Rogue Wave Views 5.6 |
Rogue Wave Views |
Rogue Wave Views Documentation Home |
Class for polyline displayers. More...
#include <ilviews/charts/polyline.h>
Public Member Functions | |
| IlvPolylineChartDisplayer (IlvPalette *palette=0) | |
| Constructor. | |
| virtual | ~IlvPolylineChartDisplayer () |
| Destructor. | |
| virtual IlBoolean | canBeProjectedIfOutOfBounds () const |
| Indicates whether the graphical representation can be projected when it is out-of-bounds. | |
| virtual IlvAbstractChartDisplayer * | copy () const |
| Virtual copy constructor. | |
| virtual void | drawLegendItem (IlvPort *dst, const IlvRect &legendArea, IlvPalette *itemPal, const IlvRegion *clip, IlAny clientData=0) const |
| Draws the graphic part of a legend item associated with the current displayer. | |
| virtual IlvPalette * | getProjectedPointsPalette () const |
| Returns the palette used to display out-of-bounds values. | |
| virtual IlBoolean | graphicalRepresentationByDataPoint () const |
| Indicates whether there is a graphical representation by data point. | |
| virtual IlBoolean | isContinuous () const |
| Indicates whether the graphical representation is continuous. | |
| void | setProjectedPointsPalette (IlvPalette *palette) |
| Sets the palette used to display out-of-bounds values. | |
| virtual void | treatPointsOutOfAbscissaLimits (const IlvRect &dataDisplayArea, IlvChartDisplayerPoints *dispPts, const IlvCoordInterval &abscissaRange, const IlvPoint &minLimit, const IlvPoint &maxLimit) const |
| Treats the occurrence of the points in screen coordinates that are outside the abscissa limits. | |
| virtual void | write (IlvOutputFile &) const |
| Writes the attributes of the current object in a file. | |
Protected Member Functions | |
| virtual void | computeItem (const IlvChartDisplayerPoints *dispPts, IlUInt pointIndex, IlUInt &usedPointsCount, IlvPoint *points, const IlvTransformer *t=0) const |
| Computes the item that will be displayed for a given point in screen coordinates corresponding to a data point to display. | |
| virtual void | drawItem (const IlvChartDisplayerPoints *, IlUInt pointIndex, IlUInt pointCount, IlvPoint *points, IlvPalette *itemPalette, IlvPort *dst, const IlvTransformer *t=0, const IlvRegion *clip=0) const |
| Draws the item for a given point in screen coordinates corresponding to a data point to display. | |
| virtual void | drawPoints (IlvChartDisplayerPoints *dispPts, IlvPort *dst, const IlvTransformer *t=0, const IlvRegion *clip=0) const |
| Draws the graphical representation from points in screen coordinates corresponding to the data points to display. | |
| virtual IlUInt | getItemPointsCount (const IlvChartDisplayerPoints *dispPts) const |
| Returns the maximum number of points needed to define an item for the current displayer. | |
| virtual IlvDoublePoint * | selectDataPointsForPoint (IlUInt dataPointIndex, IlUInt &count, IlUInt *&dataPointIndexes) const |
| Selects and returns the data points needed to display the graphical representation of the data points at a given index in the real data set(s) to be displayed by the current displayer. | |
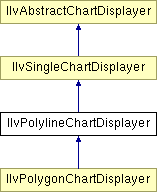
Class for polyline displayers.
Library: ilvcharts
This class is a subclass of IlvSingleChartDisplayer that allows you to represent data with a polyline.
The polyline displayer displays a unique data set. This displayer can be used with any type of projection. (See the IlvAbstractProjector class for more details.)
The following images show data sets represented with polyline displayers in a Cartesian chart (on the left) and a polar chart (on the right).
IlvSingleChartDisplayer. | IlvPolylineChartDisplayer::IlvPolylineChartDisplayer | ( | IlvPalette * | palette = 0 |
) |
Constructor.
Initializes a new IlvPolylineChartDisplayer object.
| palette | The palette that will be used to display the polyline. |
| virtual IlvPolylineChartDisplayer::~IlvPolylineChartDisplayer | ( | ) | [virtual] |
Destructor.
The destructor unlocks the palette defined for the projected points (if any).
| virtual IlBoolean IlvPolylineChartDisplayer::canBeProjectedIfOutOfBounds | ( | ) | const [virtual] |
Indicates whether the graphical representation can be projected when it is out-of-bounds.
Returns a Boolean indicating whether the graphical representation displayed by the current displayer can be projected on the limits of the data display area if the graphical representation goes outside of this area.
IlTrue by default.IlvChartGraphic::projectHorizontally and IlvChartGraphic::projectVertically methods of the chart that uses the current displayer. The following figure shows an example of this.
The screen points corresponding to data points to display are represented by black squares. In the drawing on the left, the parts of the polyline extending outside of the data display area are not projected. Only the parts of the polyline displayed in bold will appear on the screen since the drawing is clipped by the data display area. In the drawing on the right, the parts of the polyline extending outside of the data display area are projected. Points are added (those shown by white circles) in order to close the polyline that was truncated in the drawing on the left. The polyline then appears to be continuous with the projected parts following the limits of the data display area.
Reimplemented from IlvAbstractChartDisplayer.
| virtual void IlvPolylineChartDisplayer::computeItem | ( | const IlvChartDisplayerPoints * | dispPts, | |
| IlUInt | pointIndex, | |||
| IlUInt & | usedPointsCount, | |||
| IlvPoint * | points, | |||
| const IlvTransformer * | t = 0 | |||
| ) | const [protected, virtual] |
Computes the item that will be displayed for a given point in screen coordinates corresponding to a data point to display.
Computes the points defining the item that will be displayed for the point in screen coordinates stored at the index pointIndex in the dispPts object. This object stores the points in screen coordinates corresponding to the data points that have to be displayed by the current displayer. (See the IlvSingleChartDisplayer::computeItem method for more details.)
The item that will be displayed for a given screen point corresponding to a data point is a segment joining the current screen point and the following screen point corresponding to a data point to display. This segment is defined by two points: the point at the index pointIndex in the dispPts object and the point at the index pointIndex +1.
The number of points defining the item, that is 2 or 0 (if the point at the index pointIndex is the last one in dispPts), is returned in usedPointsCount.
drawPoints method to compute the item that will be displayed for each point in screen coordinates that corresponds to a data point to display. Implements IlvSingleChartDisplayer.
| virtual IlvAbstractChartDisplayer* IlvPolylineChartDisplayer::copy | ( | ) | const [virtual] |
Virtual copy constructor.
Creates and returns a copy of the current object. This method must be overloaded in subclasses. It is automatically declared by the DeclareChartDisplayerTypeInfo macro. The IlvPredefinedChartDisplayerIOMembers macro lets you define a default implementation, which returns an instance initialized with the copy constructor.
Implements IlvAbstractChartDisplayer.
Reimplemented in IlvPolygonChartDisplayer.
| virtual void IlvPolylineChartDisplayer::drawItem | ( | const IlvChartDisplayerPoints * | , | |
| IlUInt | pointIndex, | |||
| IlUInt | pointCount, | |||
| IlvPoint * | points, | |||
| IlvPalette * | itemPalette, | |||
| IlvPort * | dst, | |||
| const IlvTransformer * | t = 0, |
|||
| const IlvRegion * | clip = 0 | |||
| ) | const [protected, virtual] |
Draws the item for a given point in screen coordinates corresponding to a data point to display.
Draws the item for the point in screen coordinates that is stored at the index pointIndex in the dispPts object. This object stores the points in screen coordinates corresponding to the data points that have to be displayed by the current displayer. (See the IlvSingleChartDisplayer::drawItem method for more details.)
This method draws the part of the polyline defined by the points stored in points. This part of polyline begins at the point at the index pointIndex corresponding to a data point to display. It is composed of all the consecutive segments of the polyline that must be displayed with the same color. The polyline will be drawn at one time only if no point information is defined and so the same color is used to display the whole polyline. (See the IlvPolylineChartDisplayer::drawPoints method.) The part of polyline is drawn with the foreground color of the palette itemPalette.
drawPoints method. Implements IlvSingleChartDisplayer.
Reimplemented in IlvPolygonChartDisplayer.
| virtual void IlvPolylineChartDisplayer::drawLegendItem | ( | IlvPort * | dst, | |
| const IlvRect & | legendArea, | |||
| IlvPalette * | itemPal, | |||
| const IlvRegion * | clip, | |||
| IlAny | clientData = 0 | |||
| ) | const [virtual] |
Draws the graphic part of a legend item associated with the current displayer.
The drawing is performed in the port dst using the clipping region clip. It is bounded by the rectangle legendArea.
The current implementation of the method simply draws an horizontal line passing through the center of legendArea and bounded by this area.
| dst | The port used for the drawing. | |
| legendArea | The area where the drawing is performed. | |
| itemPal | The palette of the legend item associated with the current displayer. | |
| clip | The optional clipping region. | |
| clientData | The client data defined for the legend item associated with the current displayer. |
Reimplemented from IlvSingleChartDisplayer.
Reimplemented in IlvPolygonChartDisplayer.
| virtual void IlvPolylineChartDisplayer::drawPoints | ( | IlvChartDisplayerPoints * | dispPts, | |
| IlvPort * | dst, | |||
| const IlvTransformer * | t = 0, |
|||
| const IlvRegion * | clip = 0 | |||
| ) | const [protected, virtual] |
Draws the graphical representation from points in screen coordinates corresponding to the data points to display.
(See the IlvSingleChartDisplayer::drawPoints method for more details.)
The IlvPolylineChartDisplayer::computeItem method is used for each point in screen coordinates that corresponds to a data point to display to compute the item that will be displayed for this screen point. The IlvPolylineChartDisplayer::computeItem method returns the current screen point and the following point stored in dispPts, thus allowing the definition of a segment of the polyline to display. To improve the drawing performance, the IlvPolylineChartDisplayer::drawItem method is not necessary called for each screen point, but only when the color used to display the current segment is different from the color previously used. The IlvPolylineChartDisplayer::drawItem method can then be used to draw several segments.
The IlvSingleChartDisplayer::drawPointInfos method is used to draw the point information (if any).
Reimplemented from IlvSingleChartDisplayer.
Reimplemented in IlvPolygonChartDisplayer.
| virtual IlUInt IlvPolylineChartDisplayer::getItemPointsCount | ( | const IlvChartDisplayerPoints * | dispPts | ) | const [protected, virtual] |
Returns the maximum number of points needed to define an item for the current displayer.
| dispPts | The object that stores the points in screen coordinates to be displayed by the current displayer. |
IlvPolylineChartDisplayer::drawPoints method.) Reimplemented from IlvSingleChartDisplayer.
| virtual IlvPalette* IlvPolylineChartDisplayer::getProjectedPointsPalette | ( | ) | const [virtual] |
Returns the palette used to display out-of-bounds values.
The current implementation of the method returns a pointer to the palette object that has been set to display out-of-bounds data points for the current displayer, if such a palette has been set. Otherwise, it returns a pointer to the palette object that has been set to display out-of-bounds data points in the chart object that uses the current displayer.
Reimplemented from IlvAbstractChartDisplayer.
| virtual IlBoolean IlvPolylineChartDisplayer::graphicalRepresentationByDataPoint | ( | ) | const [virtual] |
Indicates whether there is a graphical representation by data point.
Returns a Boolean indicating whether there is a graphical representation by data point.
IlFalse by default. There is not a graphical representation by data point since the polyline that is displayed links several data points together. Reimplemented from IlvAbstractChartDisplayer.
| virtual IlBoolean IlvPolylineChartDisplayer::isContinuous | ( | ) | const [virtual] |
Indicates whether the graphical representation is continuous.
The graphical representation of data displayed by a displayer is said continuous if the graphical representation displayed for a given data point extends to and relies on another data point. So it is continuous if a given data point is not sufficient to display the graphical representation for this data point.
IlTrue by default, since the graphical representation displayed by the current displayer is a polyline that links the data points. Reimplemented from IlvAbstractChartDisplayer.
| virtual IlvDoublePoint* IlvPolylineChartDisplayer::selectDataPointsForPoint | ( | IlUInt | dataPointIndex, | |
| IlUInt & | count, | |||
| IlUInt *& | dataPointIndexes | |||
| ) | const [protected, virtual] |
Selects and returns the data points needed to display the graphical representation of the data points at a given index in the real data set(s) to be displayed by the current displayer.
(See the IlvSingleChartDisplayer::selectDataPointsForPoint method for more details.)
For a displayer displaying a data set with a polyline, the data points that are selected to be able to draw the graphical representation for a data point at a given index of the data set are the following: the data point at the index dataPointIndex plus the data point at the index before (if it exists), and the data point at the index after (if it exists). These selected data points allow the part of the polyline passing through the considered data point at the given index to be drawn.
Reimplemented from IlvSingleChartDisplayer.
Reimplemented in IlvPolygonChartDisplayer.
| void IlvPolylineChartDisplayer::setProjectedPointsPalette | ( | IlvPalette * | palette | ) |
Sets the palette used to display out-of-bounds values.
The previous palette is unlocked, and the new one is locked.
| palette | A pointer to the new palette object that will be used to display out-of-bounds data points. |
| virtual void IlvPolylineChartDisplayer::treatPointsOutOfAbscissaLimits | ( | const IlvRect & | dataDisplayArea, | |
| IlvChartDisplayerPoints * | dispPts, | |||
| const IlvCoordInterval & | abscissaRange, | |||
| const IlvPoint & | minLimit, | |||
| const IlvPoint & | maxLimit | |||
| ) | const [virtual] |
Treats the occurrence of the points in screen coordinates that are outside the abscissa limits.
(See the IlvAbstractChartDisplayer::treatPointsOutOfAbscissaLimits method for more details.)
This method computes the intersections with the abscissa limits of the parts of the polyline extending outside of these limits. The computed intersection points are added to the screen points stored in dispPts and the screen points that are outside the abscissa limits are removed from dispPts.
Reimplemented from IlvSingleChartDisplayer.
| virtual void IlvPolylineChartDisplayer::write | ( | IlvOutputFile & | file | ) | const [virtual] |
Writes the attributes of the current object in a file.
Called by the IlvAbstractChartDisplayer::save method. This method can be overloaded in subclasses that define new attributes. The information written by the write method is read by the IO constructor, which takes an IlvInputFile as its only argument. Both this method and the IO constructor can be automatically declared by using the DeclareChartDisplayerTypeInfo macro within the class declaration.
| file | The file where the attributes of the current object are written. |
Reimplemented from IlvSingleChartDisplayer.
© Copyright 2012, Rogue Wave Software, Inc. All Rights Reserved.
Rogue Wave is a registered trademark of Rogue Wave Software, Inc. in the United States and other countries. All other trademarks are the property of their respective owners.

