
Rogue Wave Views 5.6
Rogue Wave Views
Charts Package API Reference Guide
Rogue Wave Views
Documentation Home
Rogue Wave Views 5.6 |
Rogue Wave Views |
Rogue Wave Views Documentation Home |
Class for high-low displayers. More...
#include <ilviews/charts/hilo.h>
Public Member Functions | |
| IlvHiLoChartDisplayer (IlvDim width=8, IlvPalette *risePalette=0, IlvPalette *fallPalette=0) | |
| Constructor. | |
| virtual | ~IlvHiLoChartDisplayer () |
| Destructor. | |
| virtual void | getClipArea (IlvRect &area, const IlvTransformer *t) const |
| Returns the clipping region that is used for the drawing. | |
| IlvPalette * | getFallPalette () const |
| Returns the fall palette. | |
| virtual const char * | getLegendText (IlUInt index=0) const |
| Returns the text that will be used in a legend for the current displayer. | |
| virtual IlvChartDataPointInfo * | getPointInfo (IlUInt dataPointIndex, const IlvChartDataSet *dataSet=0) const |
| Returns the point information associated with a given data point. | |
| IlvPalette * | getRisePalette () const |
| Returns the rise palette. | |
| IlvDim | getSize () const |
| Returns the size of the high-low items. | |
| virtual IlvDim | getSizeAlongBase () const |
| Returns the size along the base for the graphical representation of a given data point. | |
| IlvDim | getWidth () const |
| Returns the width of the high-low items. | |
| IlUInt | getWidthPercent () const |
| Returns the width percentage of the high-low items. | |
| virtual IlBoolean | isContinuous () const |
| Indicates whether the graphical representation is continuous. | |
| virtual IlBoolean | isFilled () const |
| Indicates whether the graphical representation is filled. | |
| virtual IlBoolean | isViewable () const |
| Indicates whether the graphical representation can be viewed. | |
| void | setFallPalette (IlvPalette *pal) |
| Sets the fall palette. | |
| virtual void | setMode (IlvDrawMode mode) |
| Sets the drawing mode. | |
| virtual void | setOverwrite (IlBoolean o) |
| Sets the overwrite mode. | |
| void | setRisePalette (IlvPalette *pal) |
| Sets the rise palette. | |
| void | setWidth (IlvDim width) |
| Sets the width of the high-low items. | |
| void | setWidthPercent (IlUInt width) |
| Sets the width percentage of the high-low items. | |
| virtual IlBoolean | useVirtualDataSets () const |
| Indicates whether the current displayer uses virtual data sets. | |
Protected Member Functions | |
| virtual void | boundingBoxOfPoints (IlvChartDisplayerPoints *displayerPoints, IlvRect &bbox, IlBoolean takeInfoIntoAccount, const IlvTransformer *t=0) const |
| Returns the bounding box of the graphical representation from points in screen coordinates corresponding to the data points to display. | |
| virtual void | computeItem (const IlvChartDisplayerPoints *displayerPoints, IlUInt pointIndex, IlUInt &usedPointsCount, IlvPoint *points, const IlvTransformer *t=0) const |
| Computes the item that will be displayed for a given point in screen coordinates corresponding to a data point to display. | |
| virtual void | drawItem (const IlvChartDisplayerPoints *displayerPoints, IlUInt pointIndex, IlUInt pointCount, IlvPoint *points, IlvPalette *itemPalette, IlvPort *dst, const IlvTransformer *t=0, const IlvRegion *clip=0) const |
| Draws the item for a given point in screen coordinates corresponding to a data point to display. | |
| virtual void | drawLegendItem (IlvPort *dst, const IlvRect &legendArea, IlvPalette *itemPal, const IlvRegion *clip, IlAny clientData=0) const |
| Draws the graphic part of a legend item associated with the current displayer. | |
| virtual void | drawPoints (IlvChartDisplayerPoints *displayerPoints, IlvPort *dst, const IlvTransformer *t=0, const IlvRegion *clip=0) const |
| Draws the graphical representation from points in screen coordinates corresponding to the data points to display. | |
| virtual IlUInt | getItemPointsCount (const IlvChartDisplayerPoints *displayerPoints) const |
| Returns the maximum number of points needed to define an item for the current displayer. | |
| virtual IlvDoublePoint * | selectDataPointsForPoint (IlUInt dataPointIndex, IlUInt &count, IlUInt *&dataPointIndexes) const |
| Selects and returns the data points needed to display the graphical representation of the data points at a given index in the real data set(s) to be displayed by the current displayer. | |
| virtual void | updateVirtualDataSets () |
| Updates the virtual data set. | |
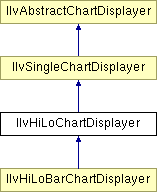
Class for high-low displayers.
Library: ilvcharts
This class is a subclass of IlvSingleChartDisplayer which allows you to represent data with high-low items composed of segments. A high-low item is made of a segment linking a low value and a high value and ending at both extremities with pins.
The high-low displayer displays two data sets. The first data set is composed of the low values and the second data set is composed of the high values.
A high-low item is drawn between each pair of low-high values, the low values being taken in order from the first data set and the high values being taken in order from the second data set. Two palettes are defined for this displayer: a rise palette and a fall palette. The rise palette is used to draw the high-low items for which the corresponding low value is smaller than the high value. The fall palette is used to draw the high-low items for which the corresponding low value is greater than the high value.
Since the high-low displayer needs to have a value from each data set that it displays to draw a high-low item, the displayer internally uses a specific virtual data set to put the data into a format that can be displayed. This virtual data set is an instance of the IlvHiLoChartDataSet class. (See this class for more details). It is composed of alternate items from the two data sets: the first data item of the first data set followed by the first data item of the second data set, then the second data item of the first data set followed by the second data item of the second data set, and so on. The virtual data set, constructed from the two real data sets that are set on the displayer, is the data set that is actually displayed by the displayer. (See the Detailed Description of the IlvAbstractChartDisplayer class for more details about virtual data sets).
This displayer can be used with any type of projection. (See the IlvAbstractProjector class for more details.)
The following images show data sets represented with a high-low displayer in a Cartesian chart (on the left) and a polar chart (on the right). The rise palette has its foreground color set to green and the fall palette to red.
IlvSingleChartDisplayer. | IlvHiLoChartDisplayer::IlvHiLoChartDisplayer | ( | IlvDim | width = 8, |
|
| IlvPalette * | risePalette = 0, |
|||
| IlvPalette * | fallPalette = 0 | |||
| ) |
Constructor.
Initializes a new IlvHiLoChartDisplayer object.
| width | The width of the high-low items. | |
| risePalette | The rise palette that will be used to draw the high-low items for which the corresponding low value is smaller than the high value. | |
| fallPalette | The fall palette that will be used to draw the high-low items for which the corresponding low value is greater than the high value . |
| virtual IlvHiLoChartDisplayer::~IlvHiLoChartDisplayer | ( | ) | [virtual] |
Destructor.
The destructor unlocks all palettes used by the current displayer.
| virtual void IlvHiLoChartDisplayer::boundingBoxOfPoints | ( | IlvChartDisplayerPoints * | displayerPoints, | |
| IlvRect & | bbox, | |||
| IlBoolean | takeInfoIntoAccount, | |||
| const IlvTransformer * | t = 0 | |||
| ) | const [protected, virtual] |
Returns the bounding box of the graphical representation from points in screen coordinates corresponding to the data points to display.
(See the IlvSingleChartDisplayer::boundingBoxOfPoints method for more details).
This method calls the IlvSingleChartDisplayer::boundingBoxOfPoints method. Then, the computed bounding box is expanded along the base by the size of the high-low items. The term base of a chart refers to the abscissa scale of this chart.
Reimplemented from IlvSingleChartDisplayer.
| virtual void IlvHiLoChartDisplayer::computeItem | ( | const IlvChartDisplayerPoints * | displayerPoints, | |
| IlUInt | pointIndex, | |||
| IlUInt & | usedPointsCount, | |||
| IlvPoint * | points, | |||
| const IlvTransformer * | t = 0 | |||
| ) | const [protected, virtual] |
Computes the item that will be displayed for a given point in screen coordinates corresponding to a data point to display.
Computes the points defining the item that will be displayed for the point in screen coordinates that is stored at the index pointIndex in the displayerPoints object. This object stores the points in screen coordinates corresponding to the data points that have to be displayed by the current displayer. (See the IlvSingleChartDisplayer::computeItem method for more details.)
The data points that are displayed are those of the virtual data set that is constructed internally from the two data sets that are set on the current displayer. (See the Detailed Description for more details.) These data points are the alternate data points of the low-values and high-values data sets. Since two data points (one from the low-values data set and one from the high-values data set) are needed to draw a high-low item, the data points of the virtual data set are considered in pairs and the computeItem method will be called once for each pair of screen points corresponding to data points to display instead of once for each screen point.
The item displayed for a given pair of screen points corresponding to a data point of the low-values data set and a data point to the high-values data set respectively is composed of a segment linking the pair of screen points with two pins perpendicular to the segment added at the extremities of the segment. Thus, the item is simply a polyline made of three segments defined by four points.
The number of computed points defining the item is returned in usedPointsCount.
drawPoints method. Implements IlvSingleChartDisplayer.
Reimplemented in IlvHiLoBarChartDisplayer.
| virtual void IlvHiLoChartDisplayer::drawItem | ( | const IlvChartDisplayerPoints * | displayerPoints, | |
| IlUInt | pointIndex, | |||
| IlUInt | pointCount, | |||
| IlvPoint * | points, | |||
| IlvPalette * | itemPalette, | |||
| IlvPort * | dst, | |||
| const IlvTransformer * | t = 0, |
|||
| const IlvRegion * | clip = 0 | |||
| ) | const [protected, virtual] |
Draws the item for a given point in screen coordinates corresponding to a data point to display.
Draws the item for the point in screen coordinates that is stored at the index pointIndex in the displayerPoints object. This object stores the points in screen coordinates corresponding to the data points that have to be displayed by the current displayer. (See the IlvSingleChartDisplayer::drawItem method for more details.)
This method draws the high-low item defined by the points stored in points. The item that is drawn is simply a polyline made of three segments. This polyline is displayed with the foreground color of the palette itemPalette. (See the IlvHiLoChartDisplayer::computeItem method for more details.)
drawPoints method. Implements IlvSingleChartDisplayer.
Reimplemented in IlvHiLoBarChartDisplayer.
| virtual void IlvHiLoChartDisplayer::drawLegendItem | ( | IlvPort * | dst, | |
| const IlvRect & | legendArea, | |||
| IlvPalette * | itemPal, | |||
| const IlvRegion * | clip, | |||
| IlAny | clientData = 0 | |||
| ) | const [protected, virtual] |
Draws the graphic part of a legend item associated with the current displayer.
The drawing is performed in the port dst using the clipping region clip. It is bounded by the rectangle legendArea.
The current implementation of the method simply draws a rectangle on the limits of legendArea with the foreground color of the palette defined for the current displayer and fills this rectangle with the background color of this palette.
| dst | The port used for the drawing. | |
| legendArea | The area where the drawing is performed. | |
| itemPal | The palette of the legend item associated with the current displayer. | |
| clip | The optional clipping region. | |
| clientData | The client data defined for the legend item associated with the current displayer. |
Reimplemented from IlvSingleChartDisplayer.
Reimplemented in IlvHiLoBarChartDisplayer.
| virtual void IlvHiLoChartDisplayer::drawPoints | ( | IlvChartDisplayerPoints * | displayerPoints, | |
| IlvPort * | dst, | |||
| const IlvTransformer * | t = 0, |
|||
| const IlvRegion * | clip = 0 | |||
| ) | const [protected, virtual] |
Draws the graphical representation from points in screen coordinates corresponding to the data points to display.
(See the IlvSingleChartDisplayer::drawPoints method for more details.)
The default implementation of this method uses the IlvHiLoChartDisplayer::getClipArea method to obtain the clipping region to be used for the drawing. Then, for each pair of points in screen coordinates stored in displayerPoints, it uses:
IlvHiLoChartDisplayer::computeItem method to compute the item that will be displayed for this pair of screen points. IlvHiLoChartDisplayer::drawItem method to draw the item for this pair of screen points. At the end, it uses the IlvSingleChartDisplayer::drawPointInfos method to draw the point information (if any).
computeItem and drawItem methods are called only once for each pair of screen points corresponding to data points to display. Reimplemented from IlvSingleChartDisplayer.
| virtual void IlvHiLoChartDisplayer::getClipArea | ( | IlvRect & | area, | |
| const IlvTransformer * | t | |||
| ) | const [virtual] |
Returns the clipping region that is used for the drawing.
The current implementation of the method returns in area the area obtained by the IlvSingleChartDisplayer::getClipArea method expanded along the base by the size of the high-low items. (The size is obtained by the IlvHiLoChartDisplayer::getSize method.) The term base of a chart refers to the abscissa scale of this chart.
| area | The clipping region that is used to clip the graphical representation of data drawn by the current displayer. | |
| t | The transformer that is applied to the returned clipping region. |
Reimplemented from IlvSingleChartDisplayer.
| IlvPalette* IlvHiLoChartDisplayer::getFallPalette | ( | ) | const |
Returns the fall palette.
| virtual IlUInt IlvHiLoChartDisplayer::getItemPointsCount | ( | const IlvChartDisplayerPoints * | displayerPoints | ) | const [protected, virtual] |
Returns the maximum number of points needed to define an item for the current displayer.
(See the IlvHiLoChartDisplayer::computeItem method for more details.)
| displayerPoints | The object that stores the points in screen coordinates to be displayed by the current displayer. |
4. Reimplemented from IlvSingleChartDisplayer.
Reimplemented in IlvHiLoBarChartDisplayer.
| virtual const char* IlvHiLoChartDisplayer::getLegendText | ( | IlUInt | index = 0 |
) | const [virtual] |
Returns the text that will be used in a legend for the current displayer.
This method returns the legend text stored inside the current displayer if it is defined. Otherwise, it returns the names of the data sets storing the low and high values that are displayed by the current displayer. The names of the data sets are separated by the character "|".
See the IlvAbstractChartDisplayer::getLegendText method for more details.
| index | This parameter is meaningless and can be omitted since the current displayer is not a composite displayer. In the case of a composite displayer, this parameter indicates the index of the displayer within the displayers that compose the composite displayer. |
Reimplemented from IlvSingleChartDisplayer.
| virtual IlvChartDataPointInfo* IlvHiLoChartDisplayer::getPointInfo | ( | IlUInt | dataPointIndex, | |
| const IlvChartDataSet * | dataSet = 0 | |||
| ) | const [virtual] |
Returns the point information associated with a given data point.
Returns the point information associated with the data point at the index index in the data set dataSet if dataSet is different from 0. dataSet must be a real data set displayed by the current displayer. If dataSet is equal to 0, the point information associated with a given data point is searched for in the alternate data points of the low-values and high-values data sets that make up the virtual data set used by the current displayer. The point information that is returned is then the point information for the data item at the index dataPointIndex /2 in the data set getRealDataSet(dataPointIndex % 2).
See the IlvAbstractChartDisplayer::getPointInfo method for more details.
| dataPointIndex | The index of the data point for which we want to retrieve the point information. | |
| dataSet | The data set to which the data point belongs. |
Reimplemented from IlvAbstractChartDisplayer.
| IlvPalette* IlvHiLoChartDisplayer::getRisePalette | ( | ) | const |
Returns the rise palette.
| IlvDim IlvHiLoChartDisplayer::getSize | ( | ) | const |
Returns the size of the high-low items.
| virtual IlvDim IlvHiLoChartDisplayer::getSizeAlongBase | ( | ) | const [virtual] |
Returns the size along the base for the graphical representation of a given data point.
(See the IlvSingleChartDisplayer::getSizeAlongBase method for more details.)
IlvHiLoChartDisplayer::getSize method. Reimplemented from IlvSingleChartDisplayer.
| IlvDim IlvHiLoChartDisplayer::getWidth | ( | ) | const |
Returns the width of the high-low items.
| IlUInt IlvHiLoChartDisplayer::getWidthPercent | ( | ) | const |
Returns the width percentage of the high-low items.
| virtual IlBoolean IlvHiLoChartDisplayer::isContinuous | ( | ) | const [virtual] |
Indicates whether the graphical representation is continuous.
The graphical representation of data displayed by a displayer is continuous if the graphical representation displayed for a given data point extends to and relies on another data point. It is continuous if a given data point is not sufficient to display the graphical representation for the data point.
IlTrue by default since the graphical representation displayed by the current displayer is made up of high-low items that link pairs of data points with segments. Reimplemented from IlvAbstractChartDisplayer.
| virtual IlBoolean IlvHiLoChartDisplayer::isFilled | ( | ) | const [virtual] |
Indicates whether the graphical representation is filled.
A graphical representation is filled for a given data point if it is not only located around this data point but also if it extends towards the origin. This is the case for displayers representing data with high-low items, since a high-low item extends along the ordinate between a low and a high value. (See the IlvAbstractChartDisplayer::isFilled method for more details).
IlTrue by default. Reimplemented from IlvAbstractChartDisplayer.
| virtual IlBoolean IlvHiLoChartDisplayer::isViewable | ( | ) | const [virtual] |
Indicates whether the graphical representation can be viewed.
The graphical representation displayed by the current displayer can be viewed if and only if all the elements required to be able to display this graphical representation are verified. It can be viewed if the graphical representation is visible, if the number of data sets to display is greater than or equal to 2, and if the coordinate information associated with the ordinate scale considered to display the data is defined.
IlTrue if the graphical representation displayed by the current displayer can be viewed and IlFalse otherwise. Reimplemented from IlvAbstractChartDisplayer.
| virtual IlvDoublePoint* IlvHiLoChartDisplayer::selectDataPointsForPoint | ( | IlUInt | dataPointIndex, | |
| IlUInt & | count, | |||
| IlUInt *& | dataPointIndexes | |||
| ) | const [protected, virtual] |
Selects and returns the data points needed to display the graphical representation of the data points at a given index in the real data set(s) to be displayed by the current displayer.
(See the IlvSingleChartDisplayer::selectDataPointsForPoint method for more details.)
The data points are selected in the virtual data set that is constructed internally from the two data sets that are set on the current displayer, since the data points of this virtual data set are the data points that are finally displayed. (See the Detailed Description for more details).
For a high-low displayer, the data points that are selected to be able to draw the high-low item for the data points at the dataPointIndex index in the low-values and high-values data sets are: the data points at the index dataPointIndex *2 and at the index dataPointIndex *2+1 in the virtual data set. These two data points correspond to the data points at the index dataPointIndex in the data set storing the low values and in the data set storing the high values.
Reimplemented from IlvSingleChartDisplayer.
| void IlvHiLoChartDisplayer::setFallPalette | ( | IlvPalette * | pal | ) |
Sets the fall palette.
The old palette, if one exists, is unlocked and the new palette is locked.
| pal | The new fall palette that is used to draw the high-low items for which the corresponding low value is greater than the high value. |
| virtual void IlvHiLoChartDisplayer::setMode | ( | IlvDrawMode | mode | ) | [virtual] |
Sets the drawing mode.
Sets the drawing mode for the current object. The information is passed to all the palettes used by the current displayer to display data.
| mode | The new drawing mode for the current object. |
Reimplemented from IlvSingleChartDisplayer.
| virtual void IlvHiLoChartDisplayer::setOverwrite | ( | IlBoolean | o | ) | [virtual] |
Sets the overwrite mode.
Modifies the way the drawing member functions of the current object operate when drawing on the root port. If the o parameter is set to IlFalse, the drawing operations are hidden by the windows stored on the top window. If the parameter is set to IlTrue, the drawing operations are performed on top of every window present on the screen, just as if the windows were part of the root window. The information is passed to all the palettes used by the current displayer to display data.
| o | The new value of the Boolean indicating the way the drawing member functions operate. |
Reimplemented from IlvSingleChartDisplayer.
| void IlvHiLoChartDisplayer::setRisePalette | ( | IlvPalette * | pal | ) |
Sets the rise palette.
The old palette, if one exists, is unlocked and the new palette is locked.
| pal | The new rise palette that is used to draw the high-low items for which the corresponding low value is smaller than the high value. |
| void IlvHiLoChartDisplayer::setWidth | ( | IlvDim | width | ) |
Sets the width of the high-low items.
| width | The new width of the high-low items. |
| void IlvHiLoChartDisplayer::setWidthPercent | ( | IlUInt | width | ) |
Sets the width percentage of the high-low items.
The width of the high-low items will be computed as a percentage of the available space between two abscissa points. Therefore, the items width will grow along if the chart is enlarged or if the visible range is reduced.
| width | The width percentage, between 0 and 100 . |
| virtual void IlvHiLoChartDisplayer::updateVirtualDataSets | ( | ) | [protected, virtual] |
Updates the virtual data set.
This method first removes the existing virtual data set and then constructs the new virtual data set of the IlvHiLoChartDataSet type used by the current displayer. This virtual data set is composed of the two data sets (the data set storing the low values and the data set storing the high values) that have to be displayed by the current displayer.
IlvAbstractChartDisplayer::update method to update the virtual data sets when the real data sets have been modified. Reimplemented from IlvAbstractChartDisplayer.
| virtual IlBoolean IlvHiLoChartDisplayer::useVirtualDataSets | ( | ) | const [virtual] |
Indicates whether the current displayer uses virtual data sets.
IlTrue since the current displayer uses an intermediate data set to be able to display the low and high values stored in two data sets with high-low items. (See the Detailed Description for more information.) Reimplemented from IlvAbstractChartDisplayer.
© Copyright 2012, Rogue Wave Software, Inc. All Rights Reserved.
Rogue Wave is a registered trademark of Rogue Wave Software, Inc. in the United States and other countries. All other trademarks are the property of their respective owners.

