Main features of JViews Gantt
Describes the main features of JViews Gantt.

Lists the features offered by
JViews Gantt.
Describes the features offered by the chart components.
Describes the features that enable rapid application development.
Explains the MVC architecture and describes how it you use it to create multiple views from the same data model.
Describes the benefits of data connection.
Describes the benefits of customization.
Describes the benefits of styling.
Lists the complete set of interactions available.
Explains how
JViews Gantt supplies load-on-demand as an efficient way of handling large data sets in custom data models.
Describes the printing features and its benefits.
Explains how a
JViews Gantt application can be deployed on a client as an application and on a server to generate DHTML pages.
Overview
JViews Gantt comes ready-to-use and ready-to-customize. It offers you the following features:
Gantt, Schedule, and Resource Data charts, monthly and daily Calendar Views, plus use with Rogue Wave® JViews Charts
Rapid application development through the GUI of the Designer
MVC architecture
JDBC and XML data connections
Easy customization
Easy styling
Complete set of interactions
Optimized performance and scalability for handling large data sets
Fully featured printing
Use with Rogue Wave JViews Diagrammer for PERT representations
Use with Rogue Wave
JViews Maps, for example, in dispatching applications
Deployment as JavaBeans®
Deployable on client or server
Advanced capabilities for thin-client applications leveraging Asynchronous JavaScript® And XML (Ajax) concepts with JavaServer Faces (JSF) as the server-side component model and Dynamic HTML (DHTML) as the client-side display technology
Chart components
JViews Gantt comes with three chart components and two calendar view components. The Gantt charts are either activity-based (Gantt Chart) or resource-based (Schedule chart). There is also a Resource Data chart for presenting numerical information about resources and the activities assigned to them.
JViews Gantt provides multiple views of data. For example, within a chart you have the Gantt table and the Gantt sheet view of the data. See
Time and activity charts in JViews Gantt for an illustration. The table view displays the resources or the activities with their properties. Such a view is hierarchical; for example, an activity can contain subactivities and can be collapsed or expanded.
Task-oriented views are typically used in project management applications. Each task is associated with a row in the Gantt chart or a bar in the Calendar Views.
Resource-oriented views are typically used in manufacturing and transportation applications. Each row of the Gantt (or Schedule) chart is associated with a resource and the view displays in a row all the activities assigned to the resource.
The Resource Load view displays the workload of a specific resource in time.
When you purchase Rogue Wave® JViews Gantt, you get Rogue Wave JViews Charts as well for general purpose charting. You can customize the Resource Load chart. You can integrate applications developed with JViews Gantt with JViews Charts; for example, you can display trends and indicators by means of bar charts, pie charts, radar charts, and real-time charts. Full documentation is supplied in the JViews Charts package.
It is also possible to develop a PERT representation with JViews Diagrammer and to integrate this chart with JViews Gantt.
The Gantt Viewer sample found at
<installdir>/jviews-gantt/samples/ganttViewer/src/ganttviewer/GanttViewer.java shows how to integrate a PERT chart with different types of Gantt chart, a Resource Data chart, and the monthly Calendar view, if you have JViews Diagrammer installed. See
Complete planning application with PERT chart.
JViews Gantt provides an open and wide-ranging set of features with the following benefits:
Specific types of Gantt chart and a load chart adapted to specific application domains.
Integration with other types of chart included in the product.
Use with specific features of other Rogue Wave visualization products, such as PERT representations and deployment maps.
Rapid application development
JViews Gantt is ready-to-use. Each chart component is supplied as a JavaBean® with default styles and a full set of interactions. You can create, move, and resize activities, select, add constraints between tasks, pan, zoom with smart time scale, and access tooltips. JViews Gantt offers you best-in-class interactions.
All these capabilities are available through an easy-to-use GUI, the Designer. It is easy to interact with this tool to develop your Gantt chart components.
JViews Gantt lets you develop the charts completely in the GUI. A chart component can even be integrated as a JavaBean into a third-party IDE, so that you can continue to develop within your preferred environment, but using the appropriate parts of the Designer to develop the chart components.
If you can use JDBC to connect your database, if your data is in XML, if you can export your data to a flat file (CSV) format, or if you want to use an in-memory data model for testing, you can start to develop in the GUI. In this case, the classes of the library used to display the scheduling data are hidden from you. You can develop your application through a normal windowing interface with the usual interaction features, such as wizards and point-and-click. You choose the chart component that best suits your needs and customize the styling properties. There is no need to write any Java® code at this stage or to be familiar with Cascading Style Sheets (CSS) syntax.
The Designer includes the unique Style Rules feature, which allows you to define how the graphics will appear on the screen under different data conditions. Using the Designer to style your component hides the complexity of CSS. It is a very efficient way of building a chart component, which cuts development time considerably.
The output of the Designer is a project file that is loaded into the application at run time.
In fact, if you develop entirely through the Designer, the only time you will need to write any Java code is when you integrate a chart component into an application.
For more about the developing with the Designer, see
Creating a Gantt chart with the Designer.
JViews Gantt gives you:
Tooltips
Weekend grid
Overlapping task layout options
Smart time scales
Tasks and summary tasks
The benefits are:
You can integrate your own data easily through JDBC, XML, flat file, or in-memory.
Development time is cut because of:
Ready-made JavaBean® components with many included features.
Default styles and interactors.
Easy-to-use GUI.
No need to use Java or CSS explicitly to develop components.
MVC architecture
JViews Gantt makes use of a powerful Swing-like MVC architecture. MVC architecture means that there is a clear separation between data and display, consistent with Swing Java® user interface. The data model is open and extensible, as opposed to other types of closed architecture.
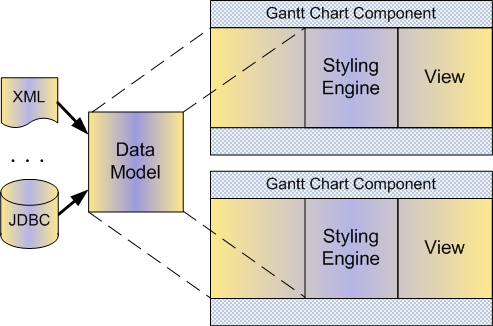
MVC architecture allows for multiple views from the same data model.
The following figure shows the data model with multiple views and data connection.
The model and the view use a publish/subscribe mechanism to notify each other about changes in the model or the view. For example, the model will publish information about updates to the model; the view subscribes to listen for any modifications to the model. The same mechanism operates in the opposite direction, so that the model subscribes to listen for updates published by the view. The scheduling data model acts as a consistency manager across views and communicates with the rest of the application.
JViews Gantt can be used as is to represent activities and subactivities, resources, constraints, and reservations.
The benefits are:
Familiar MVC concept
Open Architecture
Multiple views from the same data model
Data connection
JViews Gantt comes with JDBC, XML, flat file, and in-memory data connections ready to configure, but it can connect to any data source. The open API gives you flexibility to integrate with any back end.
XML support is through the Schedule Data eXchange Language (SDXL) for serializing data. SDXL allows the easy interchange of scheduling data.
If you need to connect to a custom data model, you must integrate it through the Java® API of the SDK instead of using the Designer.
The benefits are:
JViews Gantt is open to any back-end data connection by use of the API.
No API development necessary for JDBC database connection, XML, flat file, or in-memory data model.
Easy customization
JViews Gantt is ready-to-customize. It is easy to create custom renderers and customizable interactors, either through the Designer or the fully accessible API for additional graphic refinement.
The table and the tree are customizable. See
The added value of JViews Gantt for details about the table and the tree.
You can style screen objects by creating new styles easily.
The benefits are:
Large range of customization available with minimum effort in the Designer.
Styling done in the Designer can be fully integrated with the Java® API, if you need to do further graphic refinements.
Easy styling
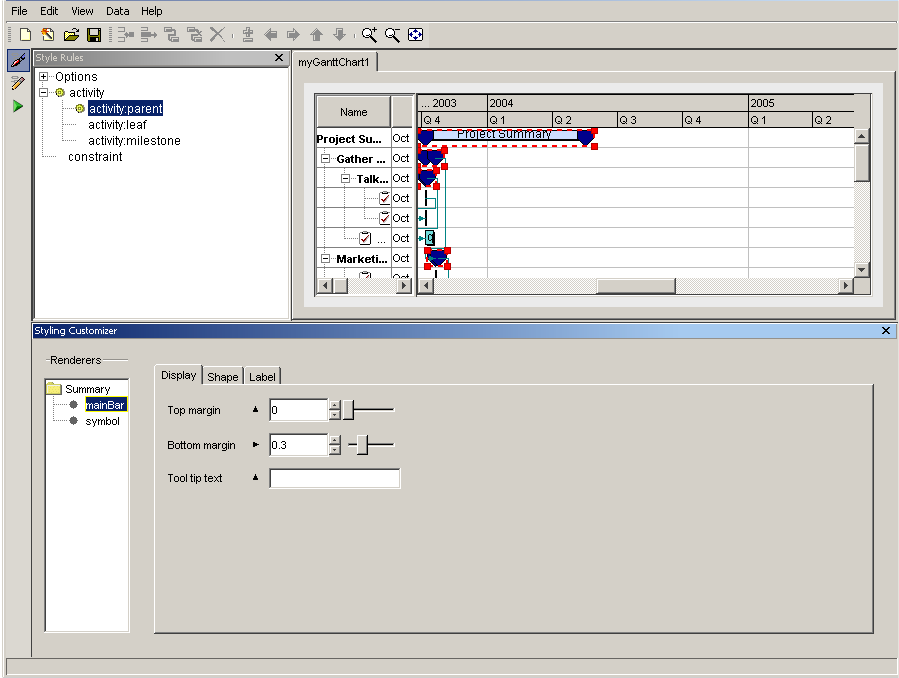
Styling in JViews Gantt is based on CSS and on a specific extension of CSS, CSS for Java®. You do not need to know CSS syntax in detail. The Designer hides the complexity of this syntax and lets you develop your styles by applying style rules through an editor based on natural language. Specific customizers allow you to refine styling with ease through the GUI. For advanced styling refinements, you can continue to develop your styling in the API.
The following image shows the customizer in the Designer.
You can write style rules to apply styling selectively, depending on the data conditions.
The benefits are:
Easy to achieve sophisticated styling and rendering.
No need to write explicit CSS syntax.
Complete set of interactions
JViews Gantt provides a full set of interactions.
In the activity-based and resource-based Gantt charts, the following Gantt sheet interactions are installed by default:
Zoom-in and zoom-out
Horizontal time scrolling and vertical scrolling
Selecting, moving, and resizing activity graphics
Tooltip
The following additional Gantt sheet interactions are available in Chart Editing Mode or with the SDK:
Zoom to fit
Making activities or resources
Making constraints or reservations
The following time scale interactions are installed by default:
Drag for scrolling horizontal time
Click or double-click for zooming in or out
The following additional interactions are provided in the Designer and the samples:
Deleting or inserting activities, resources, reservations, or constraints
Expanding or collapsing rows
Outline interactions: indent, outdent, up, or down
In Resource Data charts, the following interactions are installed by default:
Selection
Tooltip
Legend docking
In the Resource Data chart, all the interactions provided in the JViews Charts SDK are available.
The benefits are:
The large range of default interactions gives you ready-made interactors to cover most of your requirements without writing any code.
Special cases can be met by using the SDK; in some cases, the samples supply the required code ready-made.
Access to Charts interactions for Resource Data charts.
Performance and Scalability
The Gantt chart is optimized to allow fast refreshes and interactions. Schedule data often includes several thousands of activities. Very large data sets are handled seamlessly with a load-on-demand mechanism that fetches the data when it becomes visible.
JViews Gantt provides load-on-demand as an efficient way of handling large data sets in custom data models with significant time latency in retrieving activities assigned to resources. Manipulating large amounts of data in one set can slow down response times. Therefore, JViews Gantt lets you load data into memory as it is needed for display in a chart, so that you load only the relevant part of the data and performance is not adversely affected. There is no lengthy delay as the data is loaded.
Both types of Gantt chart automatically apply vertical load-on-demand with both default and custom data models. Vertical load-on-demand is the ability to defer loading row-oriented information until it is needed for display. Row-oriented information is activity data for the Gantt chart and resource data for the Schedule chart. Vertical load-on-demand applies to visible rows only. A visible row is a row that has all its parent rows expanded. A visible row is not the same as a displayed row. A displayed row is both visible and scrolled into the display window. Vertical load-on-demand does not operate on displayed rows. For example, if 20 activities are visible, but only 10 are displayed, all 20 activities are loaded. If only first level activities in the outline are visible and none of them are expanded to make their child activities visible, only the first level nodes are loaded.
The principle of vertical load-on-demand is applied in the Resource Data chart too. In the Resource Data chart, you can only query the data model for the resources that you are currently charting.
Horizontal load-on-demand is available with Schedule charts that are fed by custom data models that can query back-end data selectively. Horizontal load-on-demand is the ability to defer loading reservation data based on the currently visible time interval. As the chart is scrolled or zoomed horizontally to display different time intervals, the Schedule chart queries the data model selectively for new reservations to display.
The default data model is not susceptible to optimization of this kind. It is not able to query back-end data for a time period. It returns all reservations for all time periods and then performs the filtering at the level of the chart.
The JDBC connection applies selective querying of certain properties at the database level, thus leveraging horizontal load-on-demand.
The benefits are:
Better performance
Scalable applications
Fully featured printing
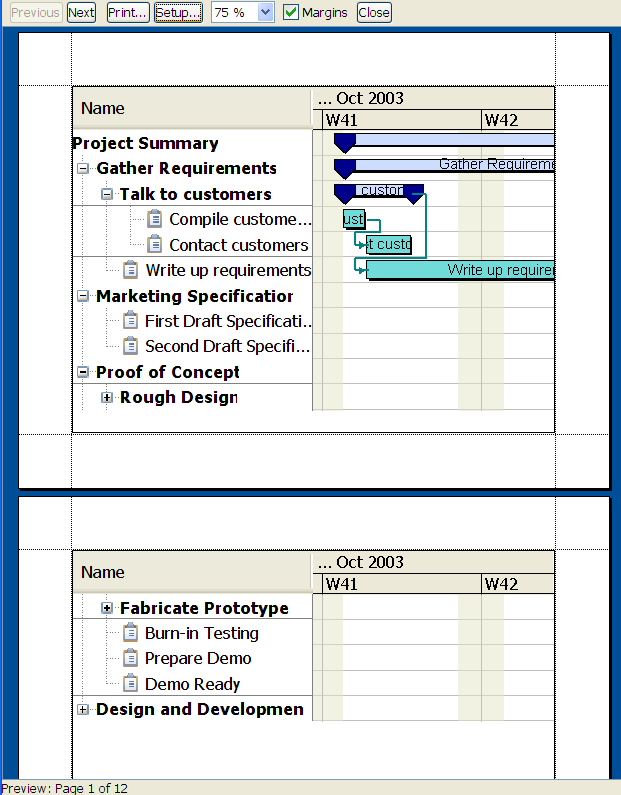
JViews Gantt has a full printing API. It offers multipage printing and print preview. The printing capability is also available from the Designer.
The following figure shows the print preview of a multipage document in JViews Gantt.
The benefits are:
The ability to achieve sophisticated printing results
Easily achievable through the Designer
Flexible deployment
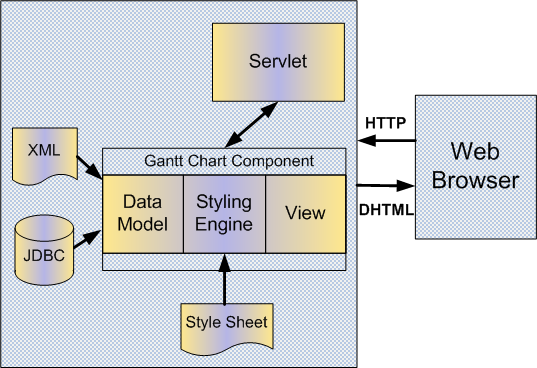
JViews Gantt can be deployed on a client as an application. It can be deployed on the server to generate DHTML pages.
Going beyond simple thin clients, JViews Gantt thin client uses the local execution capabilities of JavaScript® to provide an advanced user experience; for demanding interactions, Asynchronous JavaScript And XML concepts, or Ajax, are applied.
With JViews Gantt Faces components and JavaScript you can develop a new generation of highly responsive, highly interactive Web applications. The high responsiveness is achievable through Ajax, which supports asynchronous and partial refreshes of a Web page.
The client can continue processing while the server processes in the background. A user can continue interacting with the client without noticing latency in the response. The client does not have to wait for a response from the server before continuing, as in the traditional synchronous approach.
JViews Gantt components can be deployed as JavaBeans.
The thin client deployment has the same visually rich display as the Java® client: tree, table, Gantt, and load chart views. The rich and thin client displays are consistent.
The following figure shows a client and Server deployment.
You can also deploy your application with a map, by purchasing and integrating with JViews Maps. This facility is useful for applications such as dispatching systems.
The benefits are:
A large range of deployment possibilities
Consistent behavior between rich and thin clients
Copyright © 2018, Rogue Wave Software, Inc. All Rights Reserved.