Time and activity charts in JViews Gantt
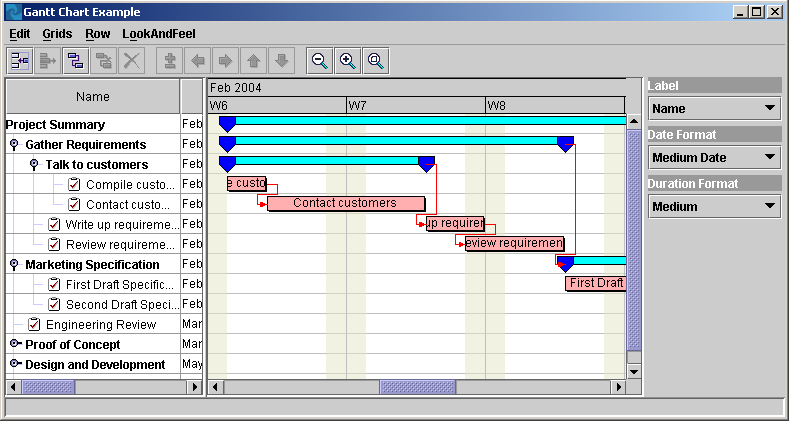
JViews Gantt provides support for creating, viewing, and editing activity-oriented Gantt charts. This type of Gantt chart shows activities and how they are distributed over time; this is the view you see in most project planning tools, such as Microsoft® Project.
The following figure shows an activity-oriented Gantt chart.
The time-dependent relationship between tasks, the constraint, is also typically shown between activities.
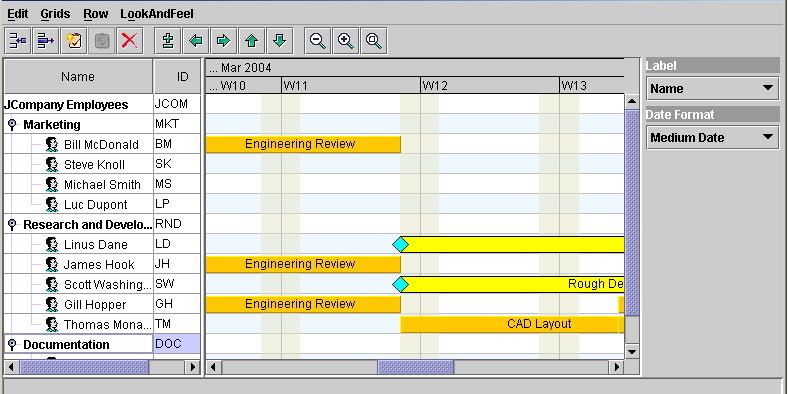
JViews Gantt provides support for creating, viewing, and editing resource-oriented Gantt charts. The resource-based Gantt chart, or Schedule chart, shows how resources are scheduled by showing the time periods during which a resource is reserved.
The following figure shows a resource-oriented Schedule chart.
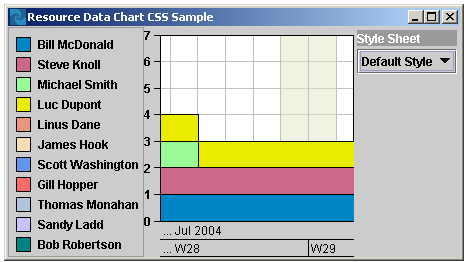
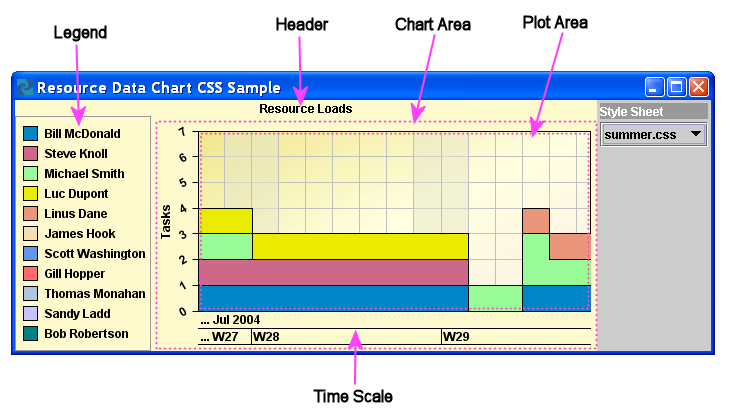
JViews Gantt provides support for creating, viewing, and editing data, primarily numerical, on resources and the activities assigned to them. The Resource Data chart is a Cartesian xy chart that displays numerical information related to the activities to which a resource is assigned against time.
The following figure shows a Resource Data chart.
Like the Gantt charts, the horizontal x axis represents time. By default, the Resource Data chart displays the number of activities simultaneously assigned to a resource as the y-axis value. This is called the loading of a resource. The Resource Data chart can be customized easily to display other numerical attributes of activities along the y axis, such as weighted averages, resource availability, resource costs, and complex load calculations.
The Resource Data chart can be rendered in a variety of styles, including polylines, area fills, or bars.
The Resource Data chart can be synchronized easily in several ways with Gantt and Schedule charts that could participate in the same user interface. You can synchronize the horizontal time access of multiple charts and you can synchronize the selection of resources in a Schedule chart with the resource data displayed in a Resource Data chart.
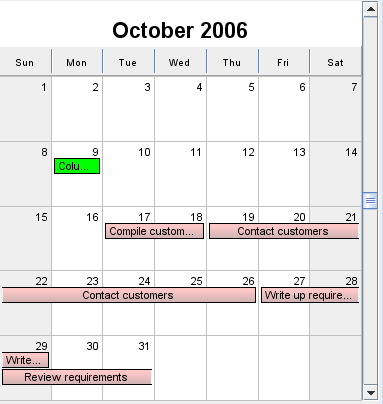
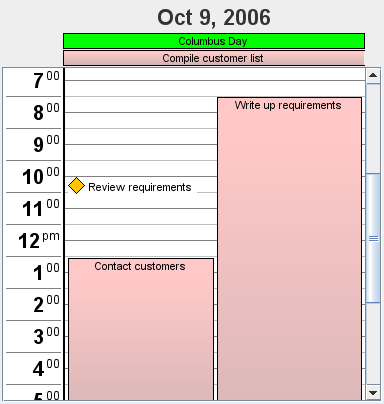
JViews Gantt provides support for creating, viewing, and editing monthly and daily Calendar Views. This type of Gantt view shows activities and how they are distributed over days within a month or hours in a day.
The following figure shows a Gantt chart with activities distributed over months.
The following figure shows an JViews Gantt calendar view with activities distributed over days.
Each chart component is built from smaller components, such as the time scale, the activity table, the activity sheet, the resource table, and the resource sheet. You can connect the chart components to your business data and display various representations of the scheduling data. You can arrange the user interface components in almost any layout to display this data.
The following figure illustrates the Gantt chart components.
The following figure shows the schedule chart components.
In the industry, what is referred to as a Gantt chart normally corresponds to the activity sheet or the resource sheet of a Gantt chart in JViews Gantt; that is, a generic Gantt chart corresponds to the graphic part of a Gantt chart in JViews Gantt. JViews Gantt provides different views of the information held in these sheets, so you can also have a table view or a tree view.
The table in the Gantt charts is derived from the Swing class JTable. Any customization allowed on a JTable object is also possible on the Gantt table. The table view can be hidden or visible. The previous two figures show examples of the table view.
The tree is a column in the table that shows a hierarchical structure of activities or resources. By default, the tree is the first column in the table. The tree is derived from the Swing JTree class adapted to be a column of a table.
The rows in the table are activities or resources. The tree column displays properties of activities or resources. By default, the name property of the given property or resource is displayed.
The following figure shows the Resource Data chart component and its subcomponents.
Copyright © 2018, Rogue Wave Software, Inc. All Rights Reserved.