Creating a Gantt chart with the Designer
The default style sheets provided with JViews Gantt display a classical activity-oriented or resource-oriented Gantt chart.
You can customize the representation with the JViews Gantt styling facilities.
The easiest way to define the chart look-and-feel is to use the Designer. You can also write your style sheet manually without the Designer and set up the chart parameters with the SDK, but you should try the Designer first before deciding to take a different route.
How the Designer helps the developer
As a Java® developer, you can decide to build chart components with the Java API of Rogue Wave®
JViews Gantt and the
CSS2 styling language. Starting with a point-and-click editor like the Designer will make the early phases of development easier and faster.
The Designer is a development tool that is designed for defining the look-and-feel of your diagram.
With the Designer:

You do not need to know the CSS syntax (although you do need to know the principles behind CSS)
You can change the graphics properties through simple dialogs
You get instant feedback on the modifications you make on style rules
You can modify the data model
You generate a
project that can be used right away in your application
The Designer offers facilities for filling the data model, viewing the Gantt chart, viewing and creating style rules, and saving a project.
See the gallery of Designer projects supplied in the JViews Gantt samples at:
Filling the data model
To use the Designer, all you need is a data model. The section
Populating the data model explains considerations on how to populate a data model.
The Designer provides a wizard that helps you to fill the data model from XML files, a JDBC connection, CSV files, or by entering the data manually. It also provides samples of models to help you get started.
Viewing the data model as a chart
Once the data model is filled, you can keep the default style sheet or select another style sheet to display the chart. At this stage, you can preview your chart in the Designer.
Viewing Style Rules
Once you have chosen a style sheet, you can start to create style rules to refine the graphical representation of your data model.
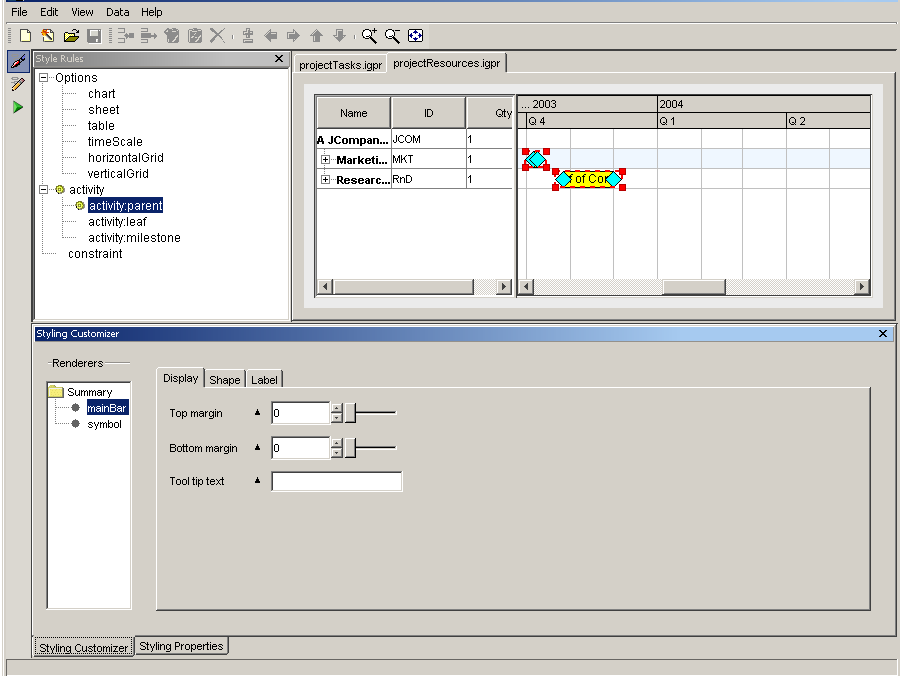
The following figure shows how the Designer presents the style rules in a tree, from which you can manage and edit rules.
The following figure shows the Style Rule hierarchy in left pane of Designer main window.
Each rule displays its conditions in the tree so that you clearly see which objects in the data model are matched by the rule. If the conditions become too long for easy reading, you can define custom rule names instead.
The graphical properties set by the rule are displayed in a panel called the Styling Customizer.
Creating Style Rules
When you create a new rule, a naturalistic language editor helps you to specify the selector part by proposing conditions based on your data model.
Once the conditions are defined, you use the Styling Customizer panel to specify the graphic effects to display when the conditions are satisfied for an activity or a constraint. You can just change graphical properties like color or shape, or you can add new shapes, texts, or images as elements of a composite graphic.
Saving the project
When you have set up the look-and-feel of your chart, you can save your project to be loaded into your application.
See the gallery of Designer projects supplied in the JViews Gantt samples at:
Copyright © 2018, Rogue Wave Software, Inc. All Rights Reserved.