For numerical data, an interval color model is used to
style ranges of values with color interpolation.
To set the color model for numerical data:
-
Open the Select Layer Attributes window for the default map. For more information, see Selecting the data to be used for styling.
-
Select POP_1994 in the Meta Data Used for Color Coding list.The following figure shows an example of the Select Layer Attribute pane with POP_1994 selected.
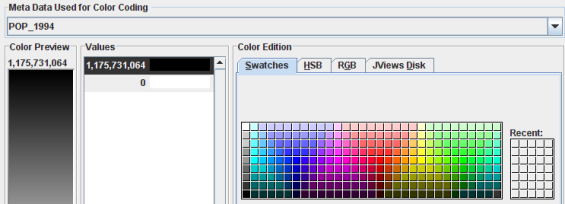 Styling numeric dataNoteRogue Wave® JViews Maps automatically computes the minimum and maximum values and assigns them to black and white shading. Any value between the minimum and maximum values is displayed with an interpolated color.
 -
Select 1,175,731,064 from the Values list and set the color to red using the Swatches tab.
-
Select 0 from the Values list and set the color to pale yellow in the Swatches tab.Noteto add or remove color steps, or change the value associated to each step, right-click an element in Values and select Insert Limit from the pop-up menu. Using this technique you can use multiple colored steps to present ranges in the data.
-
Click OK. The color styling is now visible in the map.If the styling does not appear in the map, check that the Filled option is set to true in the style property sheet.The following figure shows the resulting map with red and pale yellow colors styling set on population data.
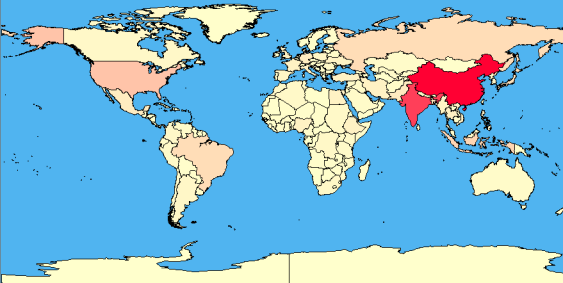 Styling for population metadata