You will use the gauge symbol created in Rotating an object and create a simple
status indicator to present BAM data.
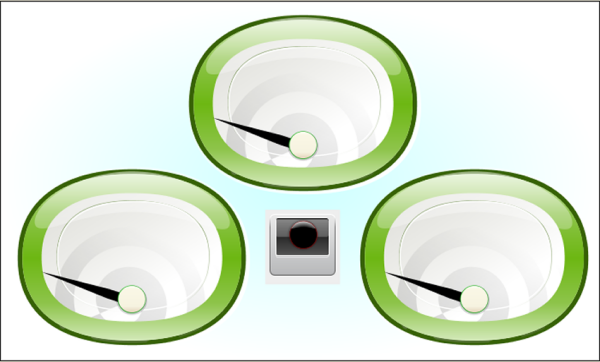
A graphics-intensive dashboard
Making a simple status indicator
To create a simple status indicator:
-
In the Symbol Editor, create a new symbol.For more information, see Making a new symbol.
-
Import image
light.svgfrom the directory <installdir>/jviews-diagrammer810/bin/symboleditor/data/examples.The SVG image creates an SVG object. For more information, see Importing a vector graphic. -
Delete the Text and Shape objects.SVG is now the base object.
-
Ungroup the SVG object.
-
Create an Integer parameter statusvalue, with three allowed values: good, warning and problem.For more details, see Setting allowed values for a parameter.
-
Select the GeneralPath8 object.
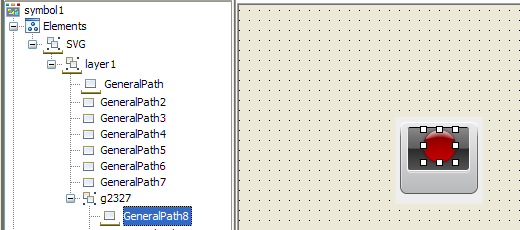 The GeneralPath8 object
 -
Add the conditions good, warning and problem to GeneralPath8 so changes to the value of statusvalue are reflected by changes in color.For more information, see Setting conditions on an object.
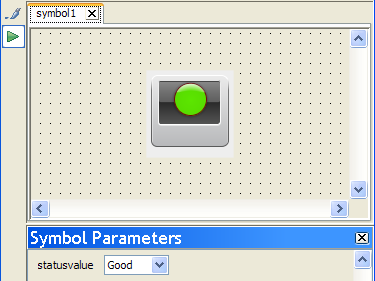 The svglight symbol
 -
Save this symbol as
svglightin the stoplights category of the bampalette.
Creating the SVG region symbol
To create a new region symbol:
-
In the Symbol Editor, open the bampalette.
-
Double-click the regionbase symbol.The regionbase symbol opens in the Symbol Editor.
-
Resize regionbase to the following dimensions: Width:701, Height:421.
-
Add the svglight and gauge symbols so the dashboard resembles figure A graphics-intensive dashboard.
-
Create new parameters and link them to the composite symbol parameters using expressions.For more information, see Connecting symbol parameters using expressions.
-
Save this symbol as
svgregionin the regions category of the bampalette.