CONTOUR Procedure
Draws a contour plot from data stored in a rectangular array.
Usage
Input Parameters
z—A 2D array containing the values that make up the contour surface.
x—(optional) A vector or 2D array specifying the x-coordinates for the contour surface.
y—(optional) A vector or 2D array specifying the y-coordinates for the contour surface.
Keywords
CONTOUR keywords let you control many aspects of the contour plot’s appearance. These keywords are listed in the following table. For a description, see Graphics and Plotting Keywords.
Discussion
If the x and y parameters are provided, the contour is plotted as a function of the X,Y locations specified by their contents. Otherwise, the contour is generated as a function of the array index of each element of z.
If x is a vector, each element of x specifies the x-coordinate for a column of z. For example, X(0) specifies the x-coordinate for Z(0, *). If the x parameter is a 2D array, each element of x specifies the x-coordinate of the corresponding point in z (xij specifies the x-coordinate for zij).
If y is a vector, each element of y specifies the y-coordinate for a row of z. If the y parameter is a 2D array, each element of y specifies the y-coordinate of the corresponding point in z (yij specifies the y-coordinate for zij).
CONTOUR draws contours using one of two different methods:
-
The first method, used by default, examines each array cell and draws all contours emanating from that cell before proceeding to the next cell. This method is efficient in terms of computer resources, but does not allow contour labeling.
-
The second method searches for each contour line and then follows the line until it reaches a boundary or closes. This method gives better-looking results with dashed line styles, and allows contour labeling, but requires more computer time. It is used if any of the following keywords is specified:
C_Annotation, C_Charsize, C_Charthick, C_Labels, Follow, Spline, or Path_Filename.
Although these two methods both draw correct contour maps, differences in their algorithms can cause small differences in the resulting graph.
Example
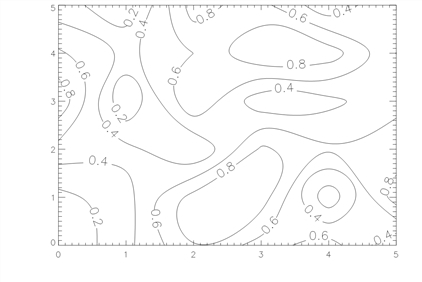
In this example, a contour plot of random data is plotted as shown in Contour Plot. The random data is generated with the PV‑WAVE IMSL Statistics RANDOMOPT procedure. The Spline keyword causes the contours to be smoothed using cubic splines. The vector assigned to the Levels keyword specifies the levels at which contours are desired. The vector of 1’s assigned to the C_Labels keyword specifies that all contour levels should be labeled. The C_Charsize keyword is used to increase the size of the labels.
; Create a 6-by-6 array of random numbers.
s = 1257
z = RANDOMU(s, 6, 6)
; Create a contour plot from the random data.
CONTOUR, z, /Spline, Levels = [0.2, 0.4, 0.6, 0.8],  $
   C_Labels = [1, 1, 1, 1], C_Charsize = 1.5
|
|