IMAGE_CONT Procedure
Standard Library procedure that overlays a contour plot onto an image display of the same array.
Usage
Input Parameters
array—The two-dimensional array to display.
Keywords
Aspect—Set to 1 to change the image’s aspect ratio. It assumes square pixels. If Aspect is not set, the aspect ratio is retained.
Interp—Set to 1 to interpolate the image with the bilinear method, when and if the image is resampled. Otherwise, the nearest neighbor method is used.
Window_Scale—Set to 1 to scale the window size to the image size. Otherwise, the image size is scaled to the window size. Window_Scale is ignored when outputting to devices with scalable pixels (e.g., PostScript devices).
Discussion
If the device you are using has scalable pixels, then the image is written over the plot window.
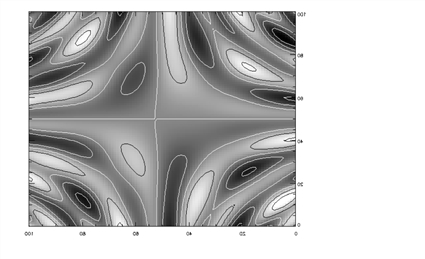
Example
This example uses IMAGE_CONT to display the image and overlaid contour plot depicting different elevations of the surface defined by:
f(x,y) = xsin(y) + ycos(x) - 10sin(xy/4)
where:
(x,y) ∈ {R2 | x, y ∈ [-10, 10]}
The results are shown in Image Contour Plot.
.RUN
; Define the function.
FUNCTION f, x, y
   RETURN, x * SIN(y) + y * COS(x) - 10 * SIN(0.25 * x * y)
END
; Create vector of x-coordinates.
x = FINDGEN(101)/5 - 10
; Create vector of y-coordinates.
y = x
; Create an array to hold the function values.
z = FLTARR(101, 101)
; Evaluate the function at the given x- and y-coordinates and
; place the result in z.
FOR i=0L, 100 DO FOR j=0L, 100 DO z(i, j) = f(x(i), y(j))
; Display image and contour plot.
IMAGE_CONT, z
|
|
See Also
For details on methods of interpolation, see the PV‑WAVE User Guide.


