The resource data CSS example
Describes how to run and customize this example application.

Explains where you find the source code for the Resource Data CSS sample and how to run it.
Describes the classes used to handle the in-memory data used for this sample.
Describes the contents of a simple style sheet and explains how it customizes a Resource Data chart.
Explains the two kinds of rules used in the sample style sheet.
Running the Example
The Resource Data CSS sample is provided with JViews Gantt to show how you can use CSS to customize the appearance of your chart. This sample appears as Load Chart Rendering (CSS) in the sample summary page found in:
The files and source code of the Resource Data CSS sample can be found in the directory:
To run the sample:
1. Ensure that the Ant utility is properly configured. If not, read
Starting the samples for instructions on how to configure Ant for
JViews Gantt.
2. Go to the directory where the sample is installed and type:
ant run
Scheduling data
The Resource Data CSS sample uses an in-memory data model that is created by the class:
The
SimpleEngineeringProject class implements a Gantt data model that simulates the scheduling of a typical engineering project. The Resource Data CSS sample instantiates the data model with factories that it uses to populate itself with instances of
IlvGeneralActivity,
IlvGeneralResource,
IlvGeneralConstraint, and
IlvGeneralReservation. As mentioned in
The Gantt and Schedule CSS examples, although you can apply styling to any Gantt data model implementation, you can only reference user-defined properties in your style sheets if your data model objects implement the
IlvUserPropertyHolder interface. The general implementations provided in the
ilog.views.gantt.model.general package implement this interface.
Customizing a Resource Data style sheet
To customize a Resource Data chart:
1. Create an empty CSS file in the data directory of the Resource Data CSS sample. The file must have a .css extension:
<installdir>/samples/cssResourceData/data/my-first-stylesheet.css
2. Run the Resource Data CSS sample (see
Running the Example) and your new style sheet will appear in the list of available style sheets. The Resource Data CSS sample makes all the style sheets available in the
cssResourceData/data directory.
3. While the Resource Data CSS sample is running, load the empty CSS file into the text editor of your choice.
4. Every time you edit the CSS file in your text editor, save your changes.
You can then test the changes you have made by switching to the Resource Data CSS sample and reapplying the style sheet to the chart. Reselect your style sheet from the list of available style sheets.
5. In the CSS file, first specify some properties of the Resource Data chart:
chart {
opaque : true;
background : lemonchiffon;
headerText : "My Chart";
}
This sets the background color of the chart and adds a header centered above it. The chart is transparent by default, so you must explicitly set its opaque property to true in order for the background color to display.
6. Add a CSS rule so that the time scale is transparent and the chart background color shows through:
#timeScale {
opaque : false;
}
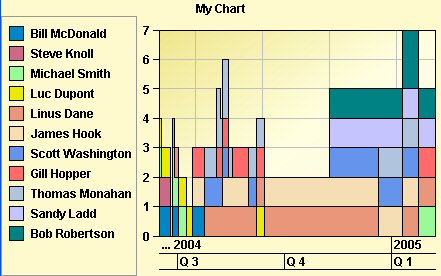
7. Add some CSS rules to give the plot area background a gradient fill and provide some insets surrounding the plot area:
chartArea {
plotStyle : @#plotStyle;
border : @#emptyBorder;
}
Subobject#plotStyle {
class : 'ilog.views.chart.IlvStyle(strokePaint, fillPaint)';
strokePaint : black;
fillPaint : 'khaki\\lightyellow\\linen';
}
Subobject#emptyBorder {
class : 'javax.swing.border.EmptyBorder(borderInsets)';
borderInsets : 6,6,6,6;
}
The following figure shows how the Resource Data chart looks with this style sheet.
8. 
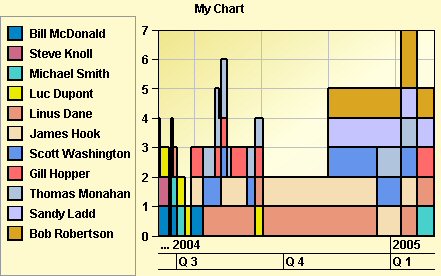
9. Finally, style the charts data series by writing additional CSS rules:
series {
lineWidth : 2.0;
}
series[name="Bob Robertson"] {
color1 : "goldenrod";
}
series[name="Michael Smith"] {
color1 : "mediumturquoise";
}
The following figure shows how the Resource Data chart looks now with the completed style sheet.
10. 
Two kinds of rules
From the previous style sheet sample, you can distinguish two sets of CSS rules:
Rules that customize the appearance of the chart and its constituent GUI components. These rules are applied to the properties of the chart and its child components.
Rules that control how Gantt data model entities, such as activities, constraints, and reservations, are rendered in the Gantt sheet of the
IlvGanttChart and
IlvScheduleChart, and are rendered as data series of the
IlvResourceDataChart. These rules are described in
Styling Gantt chart and Schedule chart data.
Copyright © 2018, Rogue Wave Software, Inc. All Rights Reserved.
