The Gantt and Schedule CSS examples
Describes how to run and customize the CSS examples.

Explains where to find and how to run the Activity Chart and Resource Chart CSS rendering samples.
Explains the XML data loaded by the example.
Explains how to write a CSS style sheet to customize a Gantt chart.
Running the examples
The Activity Chart and Resource Chart CSS rendering samples are provided with JViews Gantt to show how you can use CSS to customize the appearance of your charts.
The files and source code of the Activity Chart and Resource Chart CSS rendering samples can be found in:
To run a sample:
1. Ensure that the
Ant utility is properly configured. If not, read
Starting the samples for instructions on how to configure
Ant for
JViews Gantt.
2. Go to the directory where the sample is installed and type:
ant run
Scheduling data
The Activity Chart and Resource Chart CSS rendering samples display scheduling data that is initially loaded from the XML file:
This XML scheduling data file defines activities that contain additional user-defined properties. These properties can be used during styling to match against CSS declarations or for display in activity renderers.
The following example shows a part of the data file that defines two activities.
<activity id="A-1.1.1" name="Compile customer list" start="6-10-2000 4:53:58"
end="7-10-2000 4:53:58">
<property name="type">marketing</property>
<property name="completion">0.90</property>
</activity>
<activity id="A-1.1.2" name="Contact customers" start="7-10-2000 4:53:58"
end="9-10-2000 4:53:58">
<property name="completion">1.0</property>
</activity>
Both activities contain a
completion property that has a numeric value from
0 to
1. In addition, the first activity contains a property named
type that has the value
"marketing". The CSS rendering samples read the XML file and populate the Gantt data model with instances of
IlvGeneralActivity,
IlvGeneralResource,
IlvGeneralConstraint, and
IlvGeneralReservation. Although you can apply styling to any Gantt data model implementation, you can only reference user-defined properties in your style sheets if your data model objects implement the
IlvUserPropertyHolder interface. The
general implementations provided in the
ilog.views.gantt.model.general package implement this interface.
Customizing a Gantt chart using a simple style sheet
This section describes the contents of a simple style sheet and how it customizes a Gantt chart.
NOTE >> The following steps are based on the Gantt CSS example found in:
They also apply to the Schedule CSS example in:
To customize a Gantt chart:
1. Create an empty CSS file in the data directory of the Gantt CSS sample. The file must have a .css extension. For example:
<installdir>/samples/cssGantt/data/my-first-stylesheet.css
2. Run the Activity chart CSS rendering sample (see
Running the examples) and your new style sheet will appear in the list of available style sheets. The Activity chart CSS rendering sample makes all the style sheets available in the
cssGantt/data directory. Similarly, the Resource chart CSS rendering sample makes all the style sheets available in the
cssSchedule/data directory.
3. While the Activity chart CSS rendering sample is running, load the empty CSS file into the text editor of your choice.
4. Every time you edit the CSS file in your text editor, save your changes.
You can then test the changes you have made by switching to the Activity chart CSS rendering sample and reapplying the style sheet to the chart. Reselect your style sheet from the list of available style sheets.
5. In the CSS file, first specify some properties of the Gantt chart:
chart {
rowHeight: 25;
ganttSheetToolTipsEnabled: true;
dividerOpaqueMove: true;
}
This increases the default row height of the chart, ensures that tooltips are enabled in the Gantt sheet, and enables opaqueMove mode for the vertical divider that separates the table from the sheet.
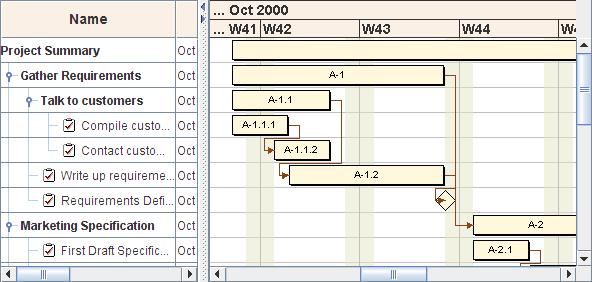
6. Add some CSS rules that give the table header and the time scale an attractive background color and a bold font:
table {
headerFont: arial,bold,14;
headerBackground: linen;
}
timeScale {
font: arial,bold,14;
background: linen;
}
The following figure shows how the Gantt chart looks with this style sheet.
7. 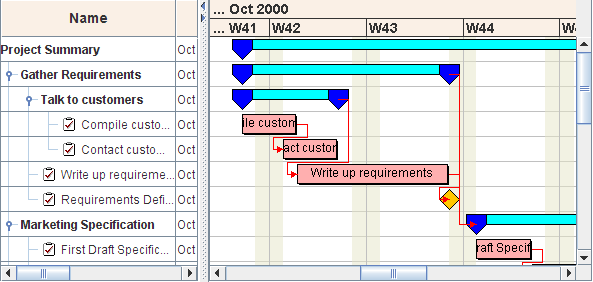
8. Finally, style the activity and constraint graphics by adding additional CSS rules. Specify that all activities are to be displayed as a simple rectangle. The ID of each activity will be displayed in the center of the rectangle in a small font. The color of the constraint links will be changed to a shade of brown that matches well with the rest of the theme.
activity {
class: 'ilog.views.gantt.graphic.renderer.IlvBasicActivityBar';
background: cornsilk;
label: "@id";
font: arial,plain,10;
}
activity:milestone {
class: 'ilog.views.gantt.graphic.renderer.IlvBasicActivitySymbol';
shape: DIAMOND;
background: black;
foreground: cornsilk;
label: @
font: @
}
constraint {
class: 'ilog.views.gantt.graphic.IlvConstraintGraphic';
foreground: saddlebrown;
}
The following figure shows how the Gantt chart looks now with the completed style sheet.
9. 
Copyright © 2018, Rogue Wave Software, Inc. All Rights Reserved.
