The default style sheet provided with JViews Diagrammer displays a classical diagram with
basic nodes and links that do not embody application-specific
properties.
To provide your user with meaningful displays, you need
to assign symbols using the Symbol Editor tool accessible through
the Designer.
The easiest way to define the diagram look and feel is
to use the Designer. You can also write your style sheet manually
without Designer, and set up the diagram parameters with the SDK,
but you should try Designer first before deciding to take a different
route.
How the Designer helps the developer
As a Java™
developer,
you can decide to build diagram components with the Java API of JViews Diagrammer and the CSS2 styling language. But starting with a point-and-click
editor like the Designer will make the early phases of development
easier and faster.
The Designer is a development tool that is designed for
defining the look and feel of your diagram.
With the Designer:
- You do not need to know the CSS syntax (although you do need to know the principles behind CSS)
- You can change the graphics properties through simple dialogs
- You get instant feedback on the modifications you make on style rules
- You can modify the data model
- You generate a project that can be used right away in your application
The Designer offers facilities for filling the data model,
viewing the diagram, viewing and creating style rules, configuring
the layout, defining a background, and saving a project.
Filling the data model
To use the Designer, all you need is a data model.
The Designer provides a wizard that helps you to fill
the data model from XML files, a JDBC connection, CSV files, or by
entering the data manually. It also provides samples of models to
help you get started.
Viewing the data model as a diagram
Once the data model is filled, you can keep the default
style sheet or select another style sheet to display the diagram.
At this stage, you can preview your diagram in the Designer.
Viewing style rules
Once you have chosen a style sheet, you can start to
create style rules to refine the graphical representation of your
data model.
The Designer presents the style rules in a tree, from
which you can manage and edit rules, see the following figure.
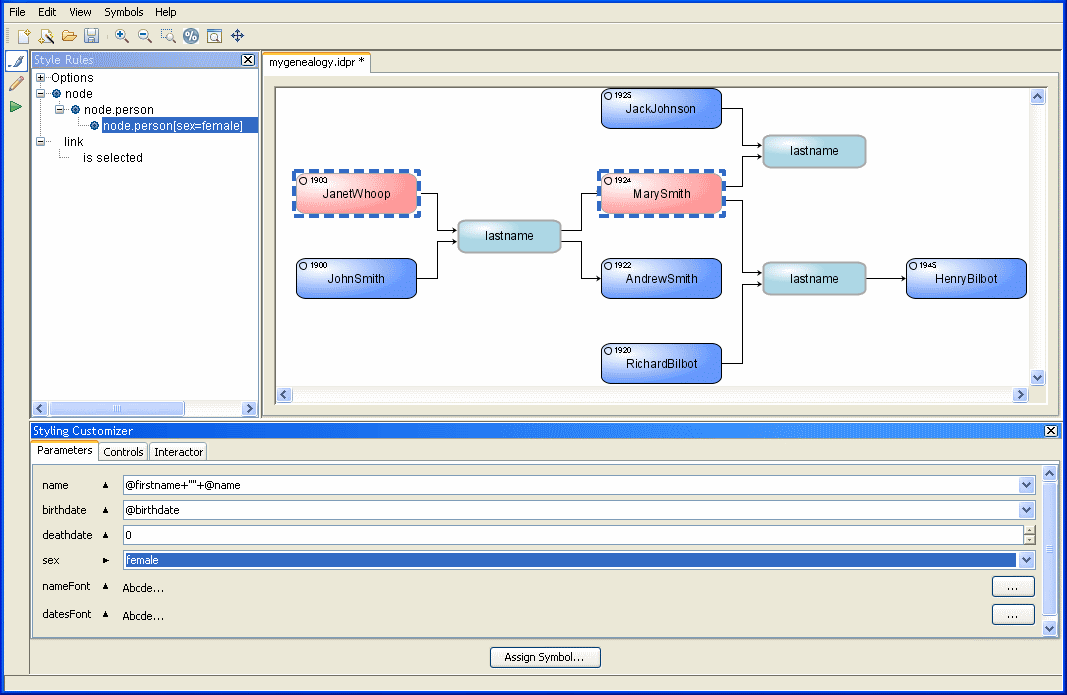
Style rules in a tree view (upper left) in the Designer
Each rule displays its conditions in the tree so that
you clearly see which objects in the data model are matched by the
rule. If the conditions become too long for easy reading, you can
define custom rule names instead.
The graphical properties set by the rule are displayed
in a panel called the Styling Customizer.
Creating style rules
When you create a new rule, a natural-language editor
helps you to specify the selector part by proposing conditions based on your
data model.
Once the conditions are defined, you use the Styling
Customizer panel to specify the graphic effects to display when the
conditions are satisfied for a node or a link.
Configuring the layout
Within the Designer, you can access the graph layout
facilities in a wizard that helps you to choose layout algorithms,
and then work in a Styling Customizer panel that lets you tune the
parameters of the selected algorithms. The result is instantly visible
in the preview window.
Note
Graph layout features are only available if you have
purchased a full JViews Diagrammer license.
Defining a background
You can add a background to the diagram—bitmap
or raster.
If you need a geographic map and you want the nodes to
be positioned according to their longitude and latitude, you will
need to use Rogue Wave® JViews Maps with
JViews Diagrammer. The Designer lets you integrate maps from Rogue Wave JViews Maps into your project.
Saving the project
When you have set up the look and feel of your diagram,
you can save your project to be loaded in your application.