Revisiting the BAM dashboard
You will use the gauge symbol created in
Rotating an object and create a simple status indicator to present BAM data.
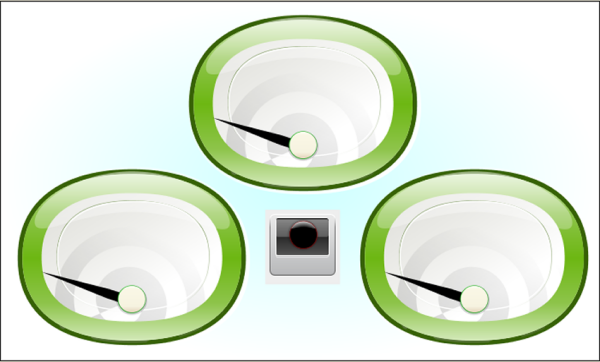
A graphics-intensive dashboard
Making a simple status indicator
To create a simple status indicator:
1. In the Symbol Editor, create a new symbol.
2. Import image light.svg from the directory <installdir>/jviews-diagrammer/bin/symboleditor/data/examples.
3. Delete the Text and Shape objects.
SVG is now the base object.
4. Ungroup the SVG object.
5. Create an Integer parameter statusvalue, with three allowed values: good, warning and problem.
6. Select the GeneralPath8 object.
7. 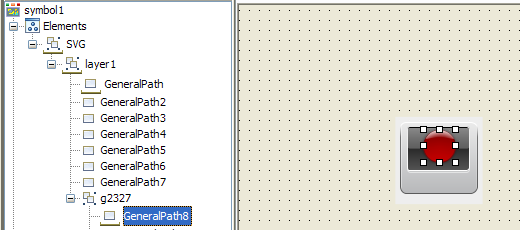
The GeneralPath8 object
8. Add the conditions good, warning and problem to GeneralPath8 so changes to the value of statusvalue are reflected by changes in color.
9. 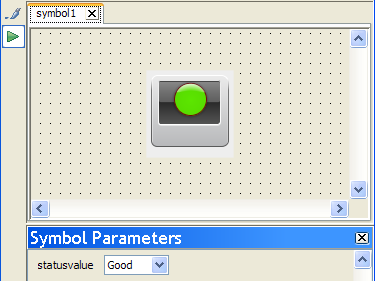
The svglight symbol
10. Save this symbol as svglight in the stoplights category of the bampalette.
Creating the SVG region symbol
To create a new region symbol:
1. In the Symbol Editor, open the bampalette.
2. Double-click the regionbase symbol.
The regionbase symbol opens in the Symbol Editor.
3. Resize regionbase to the following dimensions: Width:701, Height 421.
5. Create new parameters and link them to the composite symbol parameters using expressions.
6. Save this symbol as svgregion in the regions category of the bampalette.
Copyright © 2018, Rogue Wave Software, Inc. All Rights Reserved.