Adding a Grid Displayer to a Scale
Since a grid is attached to a scale, the type of the grid used for a given scale depends on the type of the scale. The type of the scales that can be used for a given chart depends on the type of the projection used in the chart.
The following table lists the type of scale displayers and grid displayers that can be used for a Cartesian chart, which uses a Cartesian projection.
Chart type | Cartesian |
Projection used | Cartesian |
Scale Displayers Abscissa Coordinate Ordinate Coordinate(s) | Rectangular Rectangular |
Grid Displayers Abscissa Coordinate Ordinate Coordinate(s) | Rectangular Rectangular |
The following table lists the type of scale displayers and grid displayers that can be used for a polar chart, which uses a polar projection.
Chart type | Polar |
Projection used | Polar |
Scale Displayers Abscissa Coordinate Ordinate Coordinate(s) | Circular Rectangular |
Grid Displayer(s) Abscissa Coordinate Ordinate Coordinate(s) | Radial Circular |
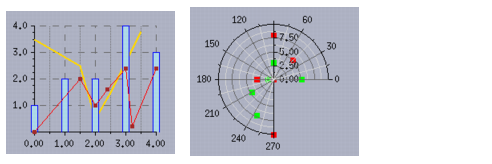
Figure 10.4 shows examples of grids that are set on the scales of two charts. Grids are set on scales in a Cartesian chart (using a Cartesian projection) and in a polar chart (using a polar projection).
Figure 10.4 Grids in a Cartesian Chart and in a Polar Chart
To create and set a grid attached to a given scale, perform the following steps:
1. Create the grid displayer to display the grid that will be attached to the scale.
Do one of the following:

Look at the tables at the beginning of this section to determine which grid can be used with the scale and create the corresponding grid displayer by hand.
or
Use the
createGridDisplayer method of the scale displayer. This method will create the correct grid displayer to be used with the scale for you.
IlvAbstractGridDisplayer* gridDisplayer = scaleDisplayer->createGridDisplayer(referenceScaleDisplayer); |
The scale displayer passed as a parameter is the displayer of the scale that must be used as a reference to know where the lines of the grid must stop. If the grid is attached to the scale representing the abscissa coordinate, the scale displayer that is passed as a parameter is the displayer of a scale representing an ordinate coordinate. If the grid is attached to a scale representing the ordinate coordinate, the scale displayer that is passed as a parameter is the displayer of the scale representing the abscissa coordinate.
2. Set the created grid displayer on the displayer of the scale to which you want to attach the grid.
scaleDisplayer->setGridDisplayer(gridDisplayer); |
The Charts Library also provides some methods at the level of a chart object that directly encapsulate the creation and setting of a grid on a scale of the chart object. The following methods are available:
IlvChartGraphic::addOrdinateGrid to add a grid on an ordinate scale.
Version 6.0
Copyright © 2015, Rogue Wave Software, Inc. All Rights Reserved.