Displaying a Grid
A grid is a graphical indicator of data values. A grid is attached to a scale and is composed of the following:

Major lines drawn at the positions of the major ticks of the scale
Minor lines drawn at the positions of the minor ticks of the scale
A grid is displayed within a chart by a dedicated object called a grid displayer.
The base class used to represent a grid displayer is the
IlvAbstractGridDisplayer class.
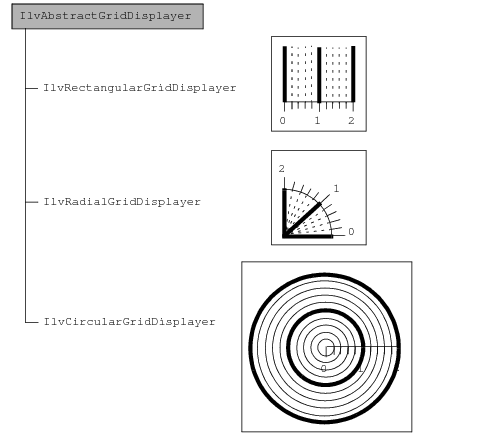
Figure 10.3 shows all the grid displayers defined in the Charts Library.
Figure 10.3 Hierarchy of Grid Displayers in the Charts Library
Version 6.0
Copyright © 2015, Rogue Wave Software, Inc. All Rights Reserved.