
Rogue Wave Views
Charts Package API Reference Guide
Rogue Wave Views
Documentation Home
|
Rogue Wave Views |
Rogue Wave Views Documentation Home |
Base class for graphic objects displaying charts. More...
#include <ilviews/charts/graphic.h>
Public Types | |
| enum | FillMode { FillNone, FillDataArea, FillGraphArea, FillDataAndGraphArea } |
| Available chart fill modes. More... | |
| enum | ScrollMode { IlvScrollModeStop, IlvScrollModeShift, IlvScrollModeCycle } |
| Available scrolling modes. More... | |
Public Member Functions | |
| IlvChartGraphic (IlvDisplay *display, const IlvRect &bbox, IlvPalette *palette=0) | |
| Constructor. More... | |
| virtual | ~IlvChartGraphic () |
| Destructor. More... | |
| IlvAbstractChartCursor * | addAbscissaCursor (IlDouble value, IlvPalette *palette=0, IlBoolean reDraw=IlTrue) |
| Adds a cursor on the abscissa axis. More... | |
| IlvAbstractGridDisplayer * | addAbscissaGrid (IlvPalette *majorPalette=0, IlvPalette *minorPalette=0, IlBoolean reDraw=IlTrue) |
| Adds a grid on the abscissa axis. More... | |
| IlBoolean | addDisplayer (IlvAbstractChartDisplayer *displayer, IlvChartDataSet *dataSet=0, IlvCoordinateInfo *ordinateInfo=0, IlUInt position=IlvLastPositionIndex) |
| Adds a displayer connected to one data set. More... | |
| virtual IlBoolean | addDisplayer (IlvAbstractChartDisplayer *displayer, IlUInt count, IlvChartDataSet *const *dataSets, IlvCoordinateInfo *ordinateInfo=0, IlUInt position=IlvLastPositionIndex) |
| Adds a displayer connected to several data sets. More... | |
| IlvAbstractChartCursor * | addOrdinateCursor (IlDouble value, IlvPalette *palette=0, IlUInt index=0, IlBoolean reDraw=IlTrue) |
| Adds a cursor on an ordinate axis. More... | |
| IlvAbstractGridDisplayer * | addOrdinateGrid (IlvPalette *majorPalette=0, IlvPalette *minorPalette=0, IlUInt index=0, IlBoolean reDraw=IlTrue) |
| Adds a grid to an ordinate axis. More... | |
| void | addOrdinateScale (IlvAbstractScaleDisplayer *scale) |
| Adds an ordinate scale. More... | |
| virtual void | dataPointsAdded (const IlvChartDataSet *ds, IlUInt iMin, IlUInt iMax, IlBoolean reDraw=IlTrue) |
| Performs the automatic update when new data are added. More... | |
| IlBoolean | dataPointsToDisplay (IlUInt count, const IlvDoublePoint *dataPoints, IlvPoint *points, const IlvCoordinateInfo *ordinateInfo, IlBoolean shiftOfCycleLength, const IlvTransformer *t=0) const |
| Converts data points to screen coordinates. More... | |
| IlBoolean | displayToDataPoints (IlUInt count, const IlvPoint *points, IlvDoublePoint *dataPoints, const IlvCoordinateInfo *ordinateInfo, IlBoolean shiftOfCycleLength, const IlvTransformer *t=0) const |
| Converts screen coordinates to data points. More... | |
| void | enableFastScroll (IlBoolean enable) |
| Enables a very efficient refresh in Shift scroll mode. More... | |
| IlvAbstractGridDisplayer * | getAbscissaGrid () const |
| Returns the abscissa grid. More... | |
| IlvCoordinateInfo * | getAbscissaInfo () const |
| Returns the coordinate information object of the abscissa. More... | |
| IlvSingleScaleDisplayer * | getAbscissaScale () const |
| Returns the abscissa scale. More... | |
| const IlvAxisCrossing * | getAxisCrossing (IlInt index) const |
| Gets crossing between coordinate axes. More... | |
| IlvAbstractChartCursor * | getCycleCursor () const |
| Returns the cycle cursor. More... | |
| IlvAbstractChartData * | getData () const |
| Returns the chart data object that manages the data sets displayed by the current object. More... | |
| void | getDataDisplayArea (IlvRect &dataDisplayArea, const IlvTransformer *t=0) const |
| Returns the data display area of the chart. More... | |
| void | getDataDisplayArea (const IlvCoordinateInfo *coordInfo, IlvRect &dataDisplayArea, const IlvTransformer *t=0) const |
| Returns the rectangle where the data values of a coordinate are projected. More... | |
| IlvChartDataSet * | getDataSet (IlUInt dataSetIndex) const |
| Returns a given data set. More... | |
| IlUInt | getDataSetIndex (const IlvChartDataSet *dataSet) const |
| Returns the index of a given data set. More... | |
| IlvChartDataSet *const * | getDataSets (IlUInt &dataSetCount) const |
| Returns the data sets. More... | |
| IlUInt | getDataSetsCount () const |
| Returns the number of data sets. More... | |
| IlvAbstractChartDisplayer * | getDisplayer (IlUInt displayerIndex) const |
| Gets one specific displayer by index. More... | |
| IlvAbstractChartDisplayer * | getDisplayerByName (const char *name) const |
| Gets one specific displayer by name. More... | |
| IlUInt | getDisplayerIndex (const IlvAbstractChartDisplayer *displayer) const |
| Returns the index of a displayer. More... | |
| IlUInt | getDisplayersCount () const |
| Returns the number of displayers. More... | |
| IlUInt | getDisplayItem (IlvAbstractChartDisplayer *&displayer, IlvChartDataSet *&dataSet, const IlvPoint &viewPoint, const IlvTransformer *t) const |
| Returns the data point whose representation on the chart includes a given screen point of the chart graphic. More... | |
| IlBoolean | getDrawingArea (IlvRect &drawingArea, const IlvTransformer *t=0) const |
| Returns the drawing area of the chart. More... | |
| void | getGraphArea (IlvRect &graphArea, const IlvTransformer *t=0) const |
| Returns the graph area of the chart. More... | |
| IlvChartLayout * | getLayout () const |
| Returns the chart layout object. More... | |
| IlvChartLegend * | getLegend () const |
| Returns the legend. More... | |
| IlUInt | getNearestPoint (IlvAbstractChartDisplayer *&displayer, IlvChartDataSet *&dataSet, const IlvPoint &viewPoint, IlvDim distance, IlvPoint &point, const IlvTransformer *t) const |
| Returns the nearest data point from a screen point of the chart graphic. More... | |
| IlvAbstractGridDisplayer * | getOrdinateGrid (IlUInt index=0) const |
| Gets an ordinate grid by index. More... | |
| IlUInt | getOrdinateGridIndex (const IlvAbstractGridDisplayer *grid) const |
| Returns the index of an ordinate grid. More... | |
| IlvCoordinateInfo * | getOrdinateInfo (IlUInt index=0) const |
| Returns the coordinate information object of an ordinate axis. More... | |
| IlUInt | getOrdinateInfoCount () const |
| Returns the number of ordinate coordinate information objects. More... | |
| IlUInt | getOrdinateInfoIndex (const IlvCoordinateInfo *info) const |
| Returns the index of an ordinate coordinate information object. More... | |
| IlvAbstractScaleDisplayer * | getOrdinateScale (IlUInt index=0) const |
| Gets an ordinate scale by index. More... | |
| IlUInt | getOrdinateScaleIndex (const IlvAbstractScaleDisplayer *scale) const |
| Returns the index of an ordinate scale. More... | |
| IlUInt | getOrdinateScalesCount () const |
| Returns the number of ordinate scales. More... | |
| IlvSingleScaleDisplayer * | getOrdinateSingleScale (IlUInt index=0) const |
| Gets a single ordinate scale by index. More... | |
| IlvPalette * | getProjectedPointsPalette () const |
| Returns the palette used to display the out-of-bounds data points that are projected. More... | |
| IlvAbstractProjector * | getProjector () const |
| Returns the projector. More... | |
| void | getProjectorArea (const IlvCoordinateInfo *coordInfo, IlvProjectorArea &projArea, const IlvTransformer *t) const |
| Returns the description of the projecting area associated with a coordinate. More... | |
| void | getProjectorArea (const IlvAbstractScaleDisplayer *scale, IlvProjectorArea &projArea, const IlvTransformer *t=0) const |
| Returns the description of the projecting area associated with a scale. More... | |
| IlvSingleScaleDisplayer * | getScaleForCursor (const IlvAbstractChartCursor *cursor) const |
| Returns the scale for a cursor. More... | |
| IlvAbstractChartCursor * | getScrollCursor () const |
| Returns the scrolling cursor. More... | |
| ScrollMode | getScrollMode () const |
| Returns the scrolling mode. More... | |
| IlDouble | getScrollRatio () const |
| Returns the scrolling ratio. More... | |
| virtual void | insertOrdinateScale (IlvAbstractScaleDisplayer *scale, IlUInt index=0) |
| Inserts an ordinate scale. More... | |
| IlBoolean | isFastScrollEnabled () const |
| Queries for the Fast Scroll mode. More... | |
| IlBoolean | isReDrawnWhenNotified () const |
| Indicates whether an automatic redraw is performed. More... | |
| void | moveCursor (IlvAbstractChartCursor *cursor, IlDouble newValue, IlBoolean reDraw=IlTrue) |
| Moves a cursor. More... | |
| virtual void | moveDisplayer (IlUInt displayerIndex, IlUInt newIndex) |
| Changes the stacking order of a displayer. More... | |
| IlBoolean | projectHorizontally () const |
| Indicates whether there is a horizontal projection of out-of-bounds data points. More... | |
| IlBoolean | projectVertically () const |
| Indicates whether there is a vertical projection of out-of-bounds data points. More... | |
| void | reDrawWhenNotified (IlBoolean reDraw) |
| Specifies whether an automatic redraw is performed. More... | |
| IlvAbstractChartCursor * | removeAbscissaCursor (IlvAbstractChartCursor *cursor, IlBoolean reDraw=IlTrue) |
| Removes a cursor from the abscissa axis. More... | |
| void | removeAbscissaGrid (IlBoolean reDraw=IlTrue) |
| Removes the grid from the abscissa axis. More... | |
| virtual void | removeAbscissaScale () |
| Removes the abscissa scale. More... | |
| virtual IlBoolean | removeDisplayer (IlUInt displayerIndex) |
| Removes a displayer. More... | |
| virtual void | removeDisplayers () |
| Removes all displayers. | |
| IlvAbstractChartCursor * | removeOrdinateCursor (IlvAbstractChartCursor *cursor, IlUInt index=0, IlBoolean reDraw=IlTrue) |
| Removes a cursor from an ordinate axis. More... | |
| void | removeOrdinateGrid (IlUInt index=0, IlBoolean reDraw=IlTrue) |
| Removes the grid from an ordinate axis. More... | |
| virtual void | removeOrdinateGrids () |
| Removes all the ordinate grids. More... | |
| virtual void | removeOrdinateScale (IlUInt index) |
| Removes an ordinate scale. More... | |
| virtual void | removeOrdinateScales () |
| Removes all the ordinate scales. More... | |
| virtual IlBoolean | replaceDisplayer (IlvAbstractChartDisplayer *oldDisplayer, IlvAbstractChartDisplayer *newDisplayer, IlBoolean copyPalettes=IlFalse) |
| Replaces one displayer by another. More... | |
| virtual void | setAbscissaGrid (IlvAbstractGridDisplayer *grid) |
| Sets the abscissa grid. More... | |
| virtual void | setAbscissaScale (IlvSingleScaleDisplayer *scale) |
| Sets the abscissa scale. More... | |
| void | setAxisCrossing (IlInt index, IlvAxisCrossing *) |
| Specifies the crossing between coordinate axes. More... | |
| void | setAxisCrossing (IlInt index, IlDouble val) |
| Specifies the crossing between coordinate axes at a fixed value. More... | |
| void | setCursorVisible (IlvAbstractChartCursor *cursor, IlBoolean visible) |
| Shows or hides a cursor. More... | |
| virtual void | setData (IlvAbstractChartData *data) |
| Sets the chart data object that manages the data sets displayed by the current object. More... | |
| void | setDrawOrder (IlvDrawOrder drawOrder) |
| Sets the drawing order for all the scales and grids defined. More... | |
| virtual void | setLayout (IlvChartLayout *layout) |
| Sets the chart layout object. More... | |
| void | setLegend (IlvChartLegend *legend) |
| Sets the legend. More... | |
| virtual void | setOrdinateGrid (IlUInt index, IlvAbstractGridDisplayer *grid) |
| Adds or replaces an ordinate grid. More... | |
| virtual void | setOrdinateScale (IlUInt index, IlvAbstractScaleDisplayer *scale) |
| Adds or replaces an ordinate scale. More... | |
| void | setProjectedPointsPalette (IlvPalette *palette) |
| Sets the palette used to display the out-of-bounds data points that are projected. More... | |
| void | setProjectHorizontally (IlBoolean projectHorizontally) |
| Specifies whether there is a horizontal projection of out-of-bounds data points. More... | |
| virtual IlBoolean | setProjector (IlvAbstractProjector *projector) |
| Sets the projector. More... | |
| void | setProjectVertically (IlBoolean projectVertically) |
| Specifies whether there is a vertical projection of out-of-bounds data points. More... | |
| void | setScrollMode (ScrollMode mode, IlBoolean createCursor=IlFalse) |
| Sets the scrolling mode. More... | |
| void | setScrollRatio (IlDouble ratio) |
| Sets the scrolling ratio. More... | |
| void | stackScales (IlUInt count, const IlvSingleScaleDisplayer *const *scales, IlDouble offsetRatio) |
| Stack several ordinate scales. More... | |
| virtual void | translateCharts (IlDouble deltaAbscissa, IlDouble deltaOrdinate, IlUInt ordinateAxisIndex=0, IlBoolean redraw=IlTrue, IlBoolean clipToAutoRange=IlTrue) |
| Translates the graphical representations of data. More... | |
| virtual void | update () |
| Updates the current object. More... | |
| void | updateAndReDraw () |
| Updates and redraws the current object. More... | |
| virtual IlBoolean | zoomCharts (const IlvCoordInterval &abscissaRange, IlBoolean redraw=IlTrue, IlBoolean clipToAutoRange=IlTrue) |
| Zooms the graphical representations of data on the abscissa axis. More... | |
| virtual IlBoolean | zoomCharts (const IlvCoordInterval &ordinateRange, IlUInt ordinateAxisIndex, IlBoolean redraw=IlTrue, IlBoolean clipToAutoRange=IlTrue) |
| Zooms the graphical representations of data on an ordinate axis. More... | |
| IlBoolean | zoomCharts (const IlvCoordInterval &abscissaRange, const IlvCoordInterval &ordinateRange, IlUInt ordinateAxisIndex=0, IlBoolean redraw=IlTrue, IlBoolean clipToAutoRange=IlTrue) |
| Zooms the graphical representations of data. More... | |
Friends | |
| class | IlvAbscissaAxisElement |
| class | IlvAxisElement |
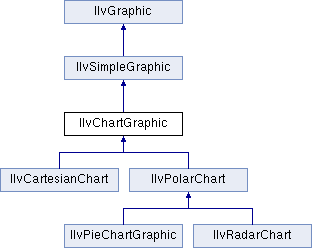
Base class for graphic objects displaying charts.
Library: ilvcharts
An instance of IlvChartGraphic makes it possible to display a chart. A chart can display a chart data object (an instance of IlvAbstractChartData), that is responsible to handle as many data sets (instances of IlvChartDataSet) that are needed. Each data set can have several graphical representations that are managed by instances of IlvAbstractChartDisplayer.
The way the data is projected to the screen is handled by a projector, which is an object of the IlvAbstractProjector type.
The chart can have one scale to represent the abscissa coordinate, and several scales (instance of IlvAbstractScaleDisplayer) for different ordinate coordinate systems. Specific information is stored for each coordinate that is represented by a different scale by the means of IlvCoordinateInfo objects.
The location and sizes of the different areas maintained by a chart graphic (where the actual data is represented, where the scales should be displayed, and so on) is maintained by a chart layout object, which is an instance of the class IlvChartLayout.
A chart graphic is able to automatically manage the scrolling of the charts when new data come in.
Available chart fill modes.
This enumeration type indicates which areas are filled within the bounding box of the chart.
| Enumerator | |
|---|---|
| FillNone |
No areas within the chart are filled. |
| FillDataArea |
The data display area is filled. (See the |
| FillGraphArea |
The graph area is filled. (See the |
| FillDataAndGraphArea |
The data display area and the graph area are filled. (See the |
Available scrolling modes.
This enumeration type indicates what kind of scrolling is wanted when new data come to the data sets.
| IlvChartGraphic::IlvChartGraphic | ( | IlvDisplay * | display, |
| const IlvRect & | bbox, | ||
| IlvPalette * | palette = 0 |
||
| ) |
Constructor.
Initializes a new IlvChartGraphic object. In its initial state, this new object is connected to an empty instance of IlvMemoryChartData. It has a default layout (instance of IlvChartLayout), no legend, no scales and no displayers.
| display | The display connection that will handle the drawing of the current object. |
| bbox | The bounding box of the current object. |
| palette | The palette used by the current object. |
|
virtual |
Destructor.
The destructor destroys the displayers that display the graphical representations of data. Then it releases the chart data object that is stored in this object (by calling its IlvAbstractChartData::unLock method), then destroys the layout that was used.
Finally, the projector and the scales are destroyed.
Note that the destructor will not destroy the legend, if there was one.
| IlvAbstractChartCursor* IlvChartGraphic::addAbscissaCursor | ( | IlDouble | value, |
| IlvPalette * | palette = 0, |
||
| IlBoolean | reDraw = IlTrue |
||
| ) |
Adds a cursor on the abscissa axis.
Cursors that make it possible to focus on precise abscissa values can be added to a chart graphic, using this method.
| value | The abscissa value where the cursor must be located. |
| palette | The palette that this cursor must use. If this parameter is omitted or set to 0, the palette that this cursor will be using is the one of the abscissa scale. |
| reDraw | If set to IlFalse, the display will not be immediately refreshed. |
| IlvAbstractGridDisplayer* IlvChartGraphic::addAbscissaGrid | ( | IlvPalette * | majorPalette = 0, |
| IlvPalette * | minorPalette = 0, |
||
| IlBoolean | reDraw = IlTrue |
||
| ) |
Adds a grid on the abscissa axis.
| majorPalette | The palette that will be used to draw the major lines of the grid. If this parameter is omitted or set to 0, the palette that will be used is the palette of the abscissa scale. |
| minorPalette | The palette that will be used to draw the minor lines of the grid. If this parameter is omitted or set to 0, the palette that will be used is the palette of the abscissa scale. |
| reDraw | If set to IlFalse, the display will not be immediately refreshed. |
| IlBoolean IlvChartGraphic::addDisplayer | ( | IlvAbstractChartDisplayer * | displayer, |
| IlvChartDataSet * | dataSet = 0, |
||
| IlvCoordinateInfo * | ordinateInfo = 0, |
||
| IlUInt | position = IlvLastPositionIndex |
||
| ) |
Adds a displayer connected to one data set.
A displayer is used to render one or several data sets that are part of the chart data object used by the current chart graphic. A chart graphic can be rendered using multiple displayers.
| displayer | The displayer to add to this chart graphic. |
| dataSet | The data set that is displayed by displayer. If this parameter is omitted or set to 0, the displayer will not be associated with any data set. If this parameter is not 0, then dataSet must be one of the data sets stored in the chart data object used by the current chart graphic. |
| ordinateInfo | The coordinate information object associated with the ordinate scale that this displayer must follow. If this parameter is omitted or set to 0, the displayer will be connected to the main (the first) ordinate scale. If this parameter is not 0, then ordinateInfo must be one of the coordinate information objects associated with an ordinate scale of the chart graphic. |
| position | The index of the new displayer. If this parameter is not specified or set to IlvLastPositionIndex, this displayer becomes the last of this chart graphic. A value of 0 indicates that the displayer becomes the bottom-most displayer (that is, the first to be displayed). |
IlTrue, that the new displayer was successfully added. If this method returns IlFalse, then there has been a problem, and an error message was produced.
|
virtual |
Adds a displayer connected to several data sets.
A displayer is used to render one or several data sets that are part of the chart data object used by the current chart graphic. A chart graphic can be rendered using multiple displayers.
| displayer | The displayer to add to this chart graphic. |
| count | The number of data sets that this displayer must render. |
| dataSets | An array of count pointers to the data sets that must be displayed by displayer. Note that all the indicated data sets must belong to the chart data object used by the current chart graphic. |
| ordinateInfo | The coordinate information object associated with the ordinate scale that this displayer must follow. If this parameter is omitted or set to 0, the displayer will be connected to the main (the first) ordinate scale. If this parameter is not 0, then ordinateInfo must be one of the coordinate information objects associated with an ordinate scale of the chart graphic. |
| position | The index of the new displayer. If this parameter is not specified, or set to IlvLastPositionIndex, this displayer becomes the last of that chart graphic. A value of 0 indicates that the displayer becomes the bottom-most displayer (that is, the first to be displayed). |
IlTrue, that the new displayer was successfully added. If this method returns IlFalse, then there was a problem, and an error message was produced. Reimplemented in IlvRadarChart.
| IlvAbstractChartCursor* IlvChartGraphic::addOrdinateCursor | ( | IlDouble | value, |
| IlvPalette * | palette = 0, |
||
| IlUInt | index = 0, |
||
| IlBoolean | reDraw = IlTrue |
||
| ) |
Adds a cursor on an ordinate axis.
Cursors that make it possible to focus on precise ordinate values can be added on a specific ordinate axis, using this method.
| value | The ordinate value where the cursor must be located. |
| index | The index of the ordinate axis that is referred to. |
| palette | The palette that this cursor must use. If this parameter is omitted or set to 0, the palette that this cursor will be using is the one of the indicated ordinate scale. |
| reDraw | If set to IlFalse, the display will not be immediately refreshed. |
| IlvAbstractGridDisplayer* IlvChartGraphic::addOrdinateGrid | ( | IlvPalette * | majorPalette = 0, |
| IlvPalette * | minorPalette = 0, |
||
| IlUInt | index = 0, |
||
| IlBoolean | reDraw = IlTrue |
||
| ) |
Adds a grid to an ordinate axis.
| index | The index of the ordinate axis that is referred to. |
| majorPalette | The palette that will be used to draw the major lines of the grid. If this parameter is omitted or set to 0, the palette that will be used is the palette of the indicated ordinate scale. |
| minorPalette | The palette that will be used to draw the minor lines of the grid. If this parameter is omitted or set to 0, the palette that will be used is the palette of the indicated ordinate scale. |
| reDraw | If set to IlFalse, the display will not be immediately refreshed. |
| void IlvChartGraphic::addOrdinateScale | ( | IlvAbstractScaleDisplayer * | scale | ) |
Adds an ordinate scale.
This method adds a ordinate scale at the end of the list of ordinate scales. It is equivalent to insertOrdinateScale(scale, IlvLastPositionIndex).
| scale | The scale to be added. |
|
virtual |
Performs the automatic update when new data are added.
Called whenever a value has been added to a data set referenced by the chart. It performs the update of the chart, depending on the scroll mode. In order to disable the notification, you can:
IlvChartDataSet::enableListener method. IlvChartDataSet::startBatch method to differ the notification. | ds | The data set that has been modified. |
| iMin | The index in the data set of the first added point. |
| iMax | The index in the data set of the last added point. |
| reDraw | A Boolean value indicating whether a reDraw operation must be performed. |
| IlBoolean IlvChartGraphic::dataPointsToDisplay | ( | IlUInt | count, |
| const IlvDoublePoint * | dataPoints, | ||
| IlvPoint * | points, | ||
| const IlvCoordinateInfo * | ordinateInfo, | ||
| IlBoolean | shiftOfCycleLength, | ||
| const IlvTransformer * | t = 0 |
||
| ) | const |
Converts data points to screen coordinates.
| count | The number of data points to be projected. |
| dataPoints | The array of count data points. |
| points | The output array where the projected points will be stored. This must be a pointer to at least count IlvPoint objects. These points are transformed by t. |
| ordinateInfo | A pointer to the coordinate information object of the ordinate axis that must be used for the projection. |
| shiftOfCycleLength | A Boolean value indicating, if IlTrue, that the data points must be shifted by the length of the cycle. |
| t | The transformer that is applied to chart graphic. |
IlTrue, that the operation was successful. If not, the returned value is IlFalse. | IlBoolean IlvChartGraphic::displayToDataPoints | ( | IlUInt | count, |
| const IlvPoint * | points, | ||
| IlvDoublePoint * | dataPoints, | ||
| const IlvCoordinateInfo * | ordinateInfo, | ||
| IlBoolean | shiftOfCycleLength, | ||
| const IlvTransformer * | t = 0 |
||
| ) | const |
Converts screen coordinates to data points.
This method lets you convert screen coordinates to data points.
| count | The number of data points to be projected. |
| points | The array where the screen points are stored. These points are considered to be already transformed by t. |
| dataPoints | The output array where the data points will be stored. This must be a pointer to at least count IlvDoublePoint objects. |
| ordinateInfo | A pointer to the coordinate information object of the ordinate axis that must be used for the projection. |
| shiftOfCycleLength | A Boolean value indicating, if IlTrue that the data points must be shifted by the length of the cycle. |
| t | The transformer that is applied to the chart graphic. |
IlTrue, that the operation was successful. If not, the returned value is IlFalse. | void IlvChartGraphic::enableFastScroll | ( | IlBoolean | enable | ) |
Enables a very efficient refresh in Shift scroll mode.
This method is meaningful only if the chart graphic is in the IlvChartGraphic::IlvScrollModeShift scroll mode.
If enabled, the Fast Scroll mode makes it possible to expect excellent performance of the chart visual update. This technique directly draws on the destination port when data points are updated. It has several limitations:
| enable | If set to IlTrue, this parameter enables the Fast Scroll mode of the chart. The mode is disabled if enable is set to IlFalse. |
| IlvAbstractGridDisplayer* IlvChartGraphic::getAbscissaGrid | ( | ) | const |
Returns the abscissa grid.
| IlvCoordinateInfo* IlvChartGraphic::getAbscissaInfo | ( | ) | const |
Returns the coordinate information object of the abscissa.
| IlvSingleScaleDisplayer* IlvChartGraphic::getAbscissaScale | ( | ) | const |
Returns the abscissa scale.
| const IlvAxisCrossing* IlvChartGraphic::getAxisCrossing | ( | IlInt | index | ) | const |
Gets crossing between coordinate axes.
| IlvAbstractChartCursor* IlvChartGraphic::getCycleCursor | ( | ) | const |
Returns the cycle cursor.
This method is meaningful only if the method setScrollMode(IlvChartGraphic::IlvScrollModeCycle, IlTrue) has been called.
setScrollMode. | IlvAbstractChartData* IlvChartGraphic::getData | ( | ) | const |
Returns the chart data object that manages the data sets displayed by the current object.
| void IlvChartGraphic::getDataDisplayArea | ( | IlvRect & | dataDisplayArea, |
| const IlvTransformer * | t = 0 |
||
| ) | const |
Returns the data display area of the chart.
This call is equivalent to getLayout()->getDataDisplayArea(dataDisplayArea, t). It returns the global rectangle where data are projected and displayed.
| dataDisplayArea | The returned chart data display area. |
| t | The transformer applied to the returned data display area. |
IlvChartLayout. | void IlvChartGraphic::getDataDisplayArea | ( | const IlvCoordinateInfo * | coordInfo, |
| IlvRect & | dataDisplayArea, | ||
| const IlvTransformer * | t = 0 |
||
| ) | const |
Returns the rectangle where the data values of a coordinate are projected.
| coordInfo | The considered coordinate. |
| dataDisplayArea | The returned rectangle. |
| t | The transformer applied to the returned rectangle. |
| IlvChartDataSet* IlvChartGraphic::getDataSet | ( | IlUInt | dataSetIndex | ) | const |
Returns a given data set.
This call is equivalent to getData()->getDataSet(dataSetIndex).
| dataSetIndex | The index of the data set that is requested. |
0 if the index is invalid. | IlUInt IlvChartGraphic::getDataSetIndex | ( | const IlvChartDataSet * | dataSet | ) | const |
Returns the index of a given data set.
This call is equivalent to getData()->getDataSetIndex(dataSet).
| dataSet | A pointer to the data set for which the index is requested. |
IlvBadIndex if the data set could not be located. | IlvChartDataSet* const* IlvChartGraphic::getDataSets | ( | IlUInt & | dataSetCount | ) | const |
Returns the data sets.
This call is equivalent to getData()->getDataSets(dataSetCount).
IlPoolOf(Pointer) and should not be deleted or modified.| dataSetCount | The number of returned data sets. |
| IlUInt IlvChartGraphic::getDataSetsCount | ( | ) | const |
Returns the number of data sets.
This call is equivalent to getData()->getDataSetsCount().
| IlvAbstractChartDisplayer* IlvChartGraphic::getDisplayer | ( | IlUInt | displayerIndex | ) | const |
Gets one specific displayer by index.
| displayerIndex | The index of the displayer to be retrieved. |
0 otherwise. | IlvAbstractChartDisplayer* IlvChartGraphic::getDisplayerByName | ( | const char * | name | ) | const |
Gets one specific displayer by name.
| name | The name of the displayer to be retrieved. |
0. | IlUInt IlvChartGraphic::getDisplayerIndex | ( | const IlvAbstractChartDisplayer * | displayer | ) | const |
Returns the index of a displayer.
| displayer | The displayer for which the user wants to retrieve the index. |
IlvBadIndex if it could not be located. | IlUInt IlvChartGraphic::getDisplayersCount | ( | ) | const |
Returns the number of displayers.
| IlUInt IlvChartGraphic::getDisplayItem | ( | IlvAbstractChartDisplayer *& | displayer, |
| IlvChartDataSet *& | dataSet, | ||
| const IlvPoint & | viewPoint, | ||
| const IlvTransformer * | t | ||
| ) | const |
Returns the data point whose representation on the chart includes a given screen point of the chart graphic.
This method finds which data point a screen point corresponds to, taking into account the geometry of the displayer (bar, line, and so on).
| displayer | A reference to a pointer to the displayer that we want to perform the test against. If this parameter is set to 0, then all displayers will be tested, and the reference will be set to a pointer to the closest displayer to viewPoint. |
| dataSet | A reference to a pointer to the data set that we want to perform the test against. If this parameter is set to 0, then all data sets displayed by the displayer displayer will be tested (or all data sets displayed by all displayers, if displayer was 0), and the reference will be set to the data set, displayed by the returned displayer, which contains the closest data point to viewPoint. |
| viewPoint | The reference point, given in the coordinates system of the displayed chart graphic. |
| t | The transformer that is applied to the chart graphic. |
IlvBadIndex if no data point could be found. | IlBoolean IlvChartGraphic::getDrawingArea | ( | IlvRect & | drawingArea, |
| const IlvTransformer * | t = 0 |
||
| ) | const |
Returns the drawing area of the chart.
This call is equivalent to getLayout()->getDrawingArea(drawingArea, t).
| drawingArea | The returned chart drawing area. |
| t | The transformer to be used to compute the drawing area. |
IlTrue. IlvChartLayout. | void IlvChartGraphic::getGraphArea | ( | IlvRect & | graphArea, |
| const IlvTransformer * | t = 0 |
||
| ) | const |
Returns the graph area of the chart.
This call is equivalent to getLayout()->getGraphArea(graphArea, t).
| graphArea | The returned chart graph area. |
| t | The transformer applied to the returned graph area. |
IlvChartLayout. | IlvChartLayout* IlvChartGraphic::getLayout | ( | ) | const |
Returns the chart layout object.
| IlvChartLegend* IlvChartGraphic::getLegend | ( | ) | const |
Returns the legend.
| IlUInt IlvChartGraphic::getNearestPoint | ( | IlvAbstractChartDisplayer *& | displayer, |
| IlvChartDataSet *& | dataSet, | ||
| const IlvPoint & | viewPoint, | ||
| IlvDim | distance, | ||
| IlvPoint & | point, | ||
| const IlvTransformer * | t | ||
| ) | const |
Returns the nearest data point from a screen point of the chart graphic.
This method finds the closest displayer and data set provided a point in the display coordinates system (that is, in the coordinates system of the chart graphic).
| displayer | A reference to a pointer to the displayer that we want to perform the test against. If this parameter is set to 0, then all displayers will be tested, and the reference will be set to a pointer to the closest displayer to viewPoint. |
| dataSet | A reference to a pointer to the data set that we want to perform the test against. If this parameter is set to 0, then all data sets displayed by the displayer displayer will be tested (or all data sets displayed by all displayers, if displayer was 0), and the reference will be set to the data set, displayed by the returned displayer, which contains the closest data point to viewPoint. |
| viewPoint | The reference point, given in the coordinates system of the displayed chart graphic. |
| distance | The threshold value over which no data point will be considered. Setting this parameter to 0 will ensure there will always be a closest point. |
| point | A reference to an IlvPoint that will be set to the exact coordinates of the point on the display that was considered the closest. |
| t | The transformer that is applied to the chart graphic. |
IlvBadIndex if no data point could be found. | IlvAbstractGridDisplayer* IlvChartGraphic::getOrdinateGrid | ( | IlUInt | index = 0 | ) | const |
Gets an ordinate grid by index.
| index | The index of the ordinate grid that is queried. |
0 if index is invalid. | IlUInt IlvChartGraphic::getOrdinateGridIndex | ( | const IlvAbstractGridDisplayer * | grid | ) | const |
Returns the index of an ordinate grid.
| grid | The ordinate grid for which we want to query the index. |
IlvBadIndex if it could not be located. | IlvCoordinateInfo* IlvChartGraphic::getOrdinateInfo | ( | IlUInt | index = 0 | ) | const |
Returns the coordinate information object of an ordinate axis.
| index | The index of the ordinate axis for which the information is queried. |
0 if index is not a valid parameter. | IlUInt IlvChartGraphic::getOrdinateInfoCount | ( | ) | const |
Returns the number of ordinate coordinate information objects.
| IlUInt IlvChartGraphic::getOrdinateInfoIndex | ( | const IlvCoordinateInfo * | info | ) | const |
Returns the index of an ordinate coordinate information object.
| info | The ordinate coordinate information object for which the index is queried. |
IlvBadIndex indicating that info is not known as a coordinate information object for an ordinate axis of this chart graphic. | IlvAbstractScaleDisplayer* IlvChartGraphic::getOrdinateScale | ( | IlUInt | index = 0 | ) | const |
Gets an ordinate scale by index.
| index | The index of the ordinate scale that is queried. |
0 if index is invalid. | IlUInt IlvChartGraphic::getOrdinateScaleIndex | ( | const IlvAbstractScaleDisplayer * | scale | ) | const |
Returns the index of an ordinate scale.
| scale | The ordinate scale for which we want to query the index. |
IlvBadIndex if it could not be located. | IlUInt IlvChartGraphic::getOrdinateScalesCount | ( | ) | const |
Returns the number of ordinate scales.
| IlvSingleScaleDisplayer* IlvChartGraphic::getOrdinateSingleScale | ( | IlUInt | index = 0 | ) | const |
Gets a single ordinate scale by index.
This method is similar to IlvChartGraphic::getOrdinateScale, except that it returns only instances of subclasses of IlvSingleScaleDisplayer.
| index | The index of the ordinate scale that is queried. |
0 if index is invalid or if the scale is not an instance of a subclass of IlvSingleScaleDisplayer. | IlvPalette* IlvChartGraphic::getProjectedPointsPalette | ( | ) | const |
Returns the palette used to display the out-of-bounds data points that are projected.
IlvChartGraphic::projectHorizontally() or IlvChartGraphic::projectVertically() methods return IlTrue. (See these methods for more details). | IlvAbstractProjector* IlvChartGraphic::getProjector | ( | ) | const |
Returns the projector.
| void IlvChartGraphic::getProjectorArea | ( | const IlvCoordinateInfo * | coordInfo, |
| IlvProjectorArea & | projArea, | ||
| const IlvTransformer * | t | ||
| ) | const |
Returns the description of the projecting area associated with a coordinate.
| coordInfo | The considered coordinate. |
| projArea | The returned projecting area. |
| t | The transformer applied to the returned area. |
| void IlvChartGraphic::getProjectorArea | ( | const IlvAbstractScaleDisplayer * | scale, |
| IlvProjectorArea & | projArea, | ||
| const IlvTransformer * | t = 0 |
||
| ) | const |
Returns the description of the projecting area associated with a scale.
| scale | The considered scale. |
| projArea | The returned projecting area. |
| t | The transformer applied to the returned area. |
| IlvSingleScaleDisplayer* IlvChartGraphic::getScaleForCursor | ( | const IlvAbstractChartCursor * | cursor | ) | const |
Returns the scale for a cursor.
| cursor | The cursor for which we query the scale. |
0 if the cursor cursor could not be located. | IlvAbstractChartCursor* IlvChartGraphic::getScrollCursor | ( | ) | const |
Returns the scrolling cursor.
This method is meaningful only if the method setScrollMode(IlvChartGraphic::IlvScrollModeShift, IlTrue) or setScrollMode(IlvChartGraphic::IlvScrollModeCycle, IlTrue) has been called.
setScrollMode. | ScrollMode IlvChartGraphic::getScrollMode | ( | ) | const |
Returns the scrolling mode.
| IlDouble IlvChartGraphic::getScrollRatio | ( | ) | const |
Returns the scrolling ratio.
0 and 1.
|
virtual |
Inserts an ordinate scale.
This method adds an ordinate scale at the indicated index to the list of ordinate scales.
| scale | The scale to be added. |
| index | The position in the ordinate scales list where this scale must be added. A value of 0 indicates that this scale should become the first of all the scales in the list. A value of IlvLastPositionIndex indicates that this scale should become the last of all the scales in the list. |
| IlBoolean IlvChartGraphic::isFastScrollEnabled | ( | ) | const |
Queries for the Fast Scroll mode.
IlTrue, that the chart graphic is in Fast Scroll mode. enableFastScroll. | IlBoolean IlvChartGraphic::isReDrawnWhenNotified | ( | ) | const |
Indicates whether an automatic redraw is performed.
When the chart graphic data is modified, there can be an automatic refresh of the chart. This is very handy, but sometimes it is not the most efficient way to update a chart graphic.
IlTrue if changes to the chart data are immediately transmitted to the screen and IlFalse otherwise. When IlFalse is returned, no redraw is performed when the chart data changes. | void IlvChartGraphic::moveCursor | ( | IlvAbstractChartCursor * | cursor, |
| IlDouble | newValue, | ||
| IlBoolean | reDraw = IlTrue |
||
| ) |
Moves a cursor.
| cursor | The cursor that must be moved. |
| newValue | The new value at which the cursor must be located (on the associated scale). |
| reDraw | If set to IlFalse, the display will not be immediately refreshed. |
Changes the stacking order of a displayer.
| displayerIndex | The index of the displayer to be reordered. |
| newIndex | The new index that this displayer will take. |
| IlBoolean IlvChartGraphic::projectHorizontally | ( | ) | const |
Indicates whether there is a horizontal projection of out-of-bounds data points.
IlTrue if the data points that are out-of-bounds should be projected horizontally on the limits of the data display area and IlFalse otherwise.setProjectHorizontally, projectVertically. | IlBoolean IlvChartGraphic::projectVertically | ( | ) | const |
Indicates whether there is a vertical projection of out-of-bounds data points.
IlTrue if the data points that are out-of-bounds should be projected vertically on the limits of the data display area and IlFalse otherwise.setProjectVertically, projectHorizontally. | void IlvChartGraphic::reDrawWhenNotified | ( | IlBoolean | reDraw | ) |
Specifies whether an automatic redraw is performed.
| reDraw | The new value of the Boolean indicating whether an automatic redraw is performed. If set to IlTrue, the chart graphic automatically updates itself when the data is modified. If set to IlFalse, the refresh must be performed manually. |
isReDrawnWhenNotified. | IlvAbstractChartCursor* IlvChartGraphic::removeAbscissaCursor | ( | IlvAbstractChartCursor * | cursor, |
| IlBoolean | reDraw = IlTrue |
||
| ) |
Removes a cursor from the abscissa axis.
The cursor is not destroyed so that it can be used elsewhere after this call (or destroyed if necessary).
| cursor | The cursor to be removed. |
| reDraw | If set to IlFalse, the display will not be immediately refreshed. |
0 if this cursor does not belong to the abscissa scale. Removes the grid from the abscissa axis.
The removed grid is destroyed.
| reDraw | If set to IlFalse, the display will not be immediately refreshed. |
|
virtual |
Removes the abscissa scale.
The previous abscissa scale is destroyed. This method is equivalent to setAbscissaScale(0).
setAbscissaScale. Removes a displayer.
The removed displayer is deleted.
| displayerIndex | The index of the displayer to be removed. |
IlTrue if the removal was performed and IlFalse if displayerIndex is an invalid index. | IlvAbstractChartCursor* IlvChartGraphic::removeOrdinateCursor | ( | IlvAbstractChartCursor * | cursor, |
| IlUInt | index = 0, |
||
| IlBoolean | reDraw = IlTrue |
||
| ) |
Removes a cursor from an ordinate axis.
The cursor is not destroyed so that it can be used elsewhere after this call (or destroyed if necessary).
| cursor | The cursor to be removed. |
| index | The index of the ordinate axis that is referred to. |
| reDraw | If set to IlFalse, the display will not be immediately refreshed. |
0 if that cursor does not belong to the indicated ordinate scale. Removes the grid from an ordinate axis.
The removed grid is destroyed.
| index | The index of the ordinate axis that is referred to. |
| reDraw | If set to IlFalse, the display will not be immediately refreshed. |
|
virtual |
Removes all the ordinate grids.
All the ordinate grids stored by this chart graphic are destroyed.
|
virtual |
Removes an ordinate scale.
The indicated scale is destroyed, and all the following ordinate scales (in the ordinate scales list) are re-indexed.
| index | The index of the ordinate scale to be removed. |
|
virtual |
Removes all the ordinate scales.
All the ordinate scales stored by this chart graphic are destroyed.
|
virtual |
Replaces one displayer by another.
The displayer newDisplayer replaces the displayer oldDisplayer at the same index. The displayer oldDisplayer is deleted.
| oldDisplayer | The displayer to replace. |
| newDisplayer | The new displayer. |
| copyPalettes | If this parameter is set to IlTrue, the method tries to assign the palettes of oldDisplayer to newDisplayer. |
IlTrue, that the old displayer was successfully replaced by the new one. If this method returns IlFalse, the replacement could not take place.
|
virtual |
Sets the abscissa grid.
The previous grid object is destroyed. If grid is set to 0, the chart graphic will not have an abscissa grid any more.
| grid | The new grid to be used for the abscissa axis. |
removeAbscissaGrid.
|
virtual |
Sets the abscissa scale.
The previous scale object is destroyed. If scale is set to 0, the chart graphic will not have an abscissa scale any more.
| scale | The new scale to be used for the abscissa axis. |
removeAbscissaScale. | void IlvChartGraphic::setAxisCrossing | ( | IlInt | index, |
| IlvAxisCrossing * | |||
| ) |
Specifies the crossing between coordinate axes.
This crossing is taken into account by displayers such as the bar chart displayer, and so on.
The object takes ownership of the IlvAxisCrossing passed as argument.
Specifies the crossing between coordinate axes at a fixed value.
This crossing is taken into account by displayers such as the bar chart displayer, and so on.
| void IlvChartGraphic::setCursorVisible | ( | IlvAbstractChartCursor * | cursor, |
| IlBoolean | visible | ||
| ) |
Shows or hides a cursor.
This method performs an automatic refresh of the invalidated areas.
| cursor | The cursor that must be shown or hidden. |
| visible | If this parameter is set to IlTrue, the indicated cursor is shown in the chart graphic. The cursor is hidden if visible is set to IlFalse. |
|
virtual |
Sets the chart data object that manages the data sets displayed by the current object.
The new chart data object is locked, and the previous one is released. The entire chart is invalidated for an update of the display.
| data | The new chart data object to be displayed. |
| void IlvChartGraphic::setDrawOrder | ( | IlvDrawOrder | drawOrder | ) |
Sets the drawing order for all the scales and grids defined.
If the drawing order is set to IlvDrawAbove, the defined scales and grids will be drawn above the graphic representations of data in the chart. If the drawing order is set to IlvDrawBelow, they will be drawn below.
| drawOrder | The new drawing order. |
|
virtual |
Sets the chart layout object.
The previous chart layout object is destroyed.
| layout | The new chart layout object to be set for this chart graphic. |
| void IlvChartGraphic::setLegend | ( | IlvChartLegend * | legend | ) |
Sets the legend.
The previous legend is not destroyed.
| legend | The new legend object for this chart graphic. |
|
virtual |
Adds or replaces an ordinate grid.
If there is a grid at the indicated index, then this grid is destroyed.
| index | Specifies the index. |
| grid | The ordinate grid to be set. |
|
virtual |
Adds or replaces an ordinate scale.
If there is a scale at the indicated index, then this scale is destroyed.
| index | Specifies the index. |
| scale | The ordinate scale to be set. |
| void IlvChartGraphic::setProjectedPointsPalette | ( | IlvPalette * | palette | ) |
Sets the palette used to display the out-of-bounds data points that are projected.
The previous palette is unlocked, and the new one is locked.
| palette | A pointer to the new palette object that will be used to display the out-of-bounds data points that are projected on the limits of the data display area. |
IlvChartGraphic::projectHorizontally() or IlvChartGraphic::projectVertically() methods return IlTrue. (See these methods for more details). | void IlvChartGraphic::setProjectHorizontally | ( | IlBoolean | projectHorizontally | ) |
Specifies whether there is a horizontal projection of out-of-bounds data points.
| projectHorizontally | The new value of the Boolean indicating whether a horizontal projection of out-of-bounds data points is requested. |
IlvChartGraphic::setProjectedPointsPalette() method).
|
virtual |
Sets the projector.
The previous projector is unlocked, and the new projector is locked. All scales are updated with the new projector.
| projector | The new projector that must be used by this chart graphic. |
IlTrue if the setting could be performed, and IlFalse if there was a problem. | void IlvChartGraphic::setProjectVertically | ( | IlBoolean | projectVertically | ) |
Specifies whether there is a vertical projection of out-of-bounds data points.
| projectVertically | The new value of the Boolean indicating whether a vertical projection of out-of-bounds data points is requested. |
IlvChartGraphic::setProjectedPointsPalette() method).| void IlvChartGraphic::setScrollMode | ( | ScrollMode | mode, |
| IlBoolean | createCursor = IlFalse |
||
| ) |
Sets the scrolling mode.
If the new scrolling mode is set to IlvChartGraphic::IlvScrollModeShift or IlvChartGraphic::IlvScrollModeCycle, the user can specify that a scrolling cursor should be displayed as well by setting the parameter createCursor to IlTrue. In the case of the cycle scroll mode, a cycle cursor, which is displayed at the beginning of the cycle, is also created.
| mode | The new scrolling mode for this chart graphic. |
| createCursor | A Boolean value indicating whether cursors are to be displayed as the chart scrolls. This is meaningful only if mode is set to IlvChartGraphic::IlvScrollModeShift or IlvChartGraphic::IlvScrollModeCycle. |
| void IlvChartGraphic::setScrollRatio | ( | IlDouble | ratio | ) |
Sets the scrolling ratio.
| ratio | The new unit ratio that is used to scroll the chart in the automatic scroll mode. |
0 and 1. | void IlvChartGraphic::stackScales | ( | IlUInt | count, |
| const IlvSingleScaleDisplayer *const * | scales, | ||
| IlDouble | offsetRatio | ||
| ) |
Stack several ordinate scales.
Stacks the scales stored in the array scales so that they share the same ordinate axis. The scales must be handled by the chart and must represent an ordinate coordinate.
| count | The number of scales to stack. |
| scales | The scales to stack. |
| offsetRatio | The offset between the stacked scales, expressed as a ratio of the whole length of the ordinate axis. |
|
virtual |
Translates the graphical representations of data.
This method translates the graphic representations of data within the current chart graphic object that displays them. The chart graphic object itself keeps its bounding box untouched.
| deltaAbscissa | The translation to be performed on the abscissa axis. |
| deltaOrdinate | The translation to be performed on the ordinate axis (the one indicated by ordinateAxisIndex). |
| ordinateAxisIndex | The index of the ordinate axis the ordinate translation refers to. If this parameter is omitted or set to 0 then the main (the first) ordinate axis will be considered. |
| redraw | If set to IlFalse, the display will not be immediately refreshed. |
| clipToAutoRange | If omitted or set to IlTrue, the result of the translation may be modified to ensure that the coordinate systems (abscissa and ordinate) remain within the range of the data sets. If this parameter is set to IlFalse this checking is not performed, and the resulting display may be irrelevant (that is, outside of the range of the data sets). |
|
virtual |
Updates the current object.
Updates the automatic data range and the layout. Called by the updateAndReDraw method.
| void IlvChartGraphic::updateAndReDraw | ( | ) |
Updates and redraws the current object.
The current implementation calls the initReDraws method on the holder of the current object, then updates the current object (by calling the IlvChartGraphic::update method), and finally calls the invalidateRegion and reDrawViews methods on the holder.
|
virtual |
Zooms the graphical representations of data on the abscissa axis.
This method changes the visible range that the abscissa axis displays.
| abscissaRange | The new range that the abscissa axis should display. |
| redraw | If set to IlFalse, the display will not be immediately refreshed. |
| clipToAutoRange | If omitted or set to IlTrue, the result of the translation may be modified to ensure that the visible part of the abscissa axis remains within the range of the data sets. If this parameter is set to IlFalse, the checking is not performed and the resulting display may be irrelevant (that is, outside of the range of the data sets). |
|
virtual |
Zooms the graphical representations of data on an ordinate axis.
This method changes the visible range that a given ordinate axis displays.
| ordinateRange | The new range that the ordinate axis (the one indicated by ordinateAxisIndex) should display. |
| ordinateAxisIndex | The index of the ordinate axis the ordinate translation refers to. |
| redraw | If set to IlFalse, the display will not be immediately refreshed. |
| clipToAutoRange | If omitted or set to IlTrue, the result of the translation may be modified to ensure that the visible part of the indicated ordinate axis remains within the range of the data sets. If this parameter is set to IlFalse, the checking is not performed and the resulting display may be irrelevant (that is, outside of the range of the data sets). |
| IlBoolean IlvChartGraphic::zoomCharts | ( | const IlvCoordInterval & | abscissaRange, |
| const IlvCoordInterval & | ordinateRange, | ||
| IlUInt | ordinateAxisIndex = 0, |
||
| IlBoolean | redraw = IlTrue, |
||
| IlBoolean | clipToAutoRange = IlTrue |
||
| ) |
Zooms the graphical representations of data.
This method changes the visible range that the abscissa and a given ordinate axis displays. The bounding box of the chart graphic object itself is not modified.
| abscissaRange | The new range that the abscissa axis should display. |
| ordinateRange | The new range that the ordinate axis (the one indicated by ordinateAxisIndex) should display. |
| ordinateAxisIndex | The index of the ordinate axis the ordinate translation refers to. If this parameter is omitted or set to 0, the main (the first) ordinate axis will be considered. |
| redraw | If set to IlFalse, the display will not be immediately refreshed. |
| clipToAutoRange | If omitted or set to IlTrue, the result of the translation may be modified to ensure that the visible parts of the chart axis remain within the range of the data sets. If this parameter is set to IlFalse, the checking is not performed and the resulting display may be irrelevant (that is, outside of the range of the data sets). |
© Copyright 2015, Rogue Wave Software, Inc. All Rights Reserved.
Rogue Wave is a registered trademark of Rogue Wave Software, Inc. in the United States and other countries. All other trademarks are the property of their respective owners.

