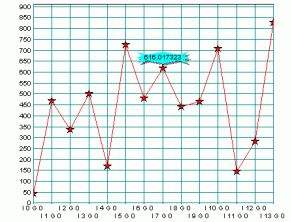

Objective Chart now has a feature that allows data items to be tagged with labels that display data values, annotations, or a combination of these items.
The style flags that control the appearance of these tags are held in the style member of the data objects themselves. The various style options are listed in Section 23.3.
The tags are generated during the draw cycle. The functions that draw the lines, wigets, and bars during processing of the DrawXXXData() routines also create tags for the data objects with the appropriate style settings.
A tag is an SRGraphLabel object and may be oriented to one of eight different rotations. Tags may also be anchored to the data points by one of several tag position styles.
A new feature is that tags and labels in general may be outlined by an arbitrary polygonal shape. The shape for the outline may be defined by a wiget, a polygon, or one of the new Objective Chart stock shapes. It is easy to define new shapes.
Figure 150 shows a polygonal tag attached to a data item in a chart.

Copyright © Rogue Wave Software, Inc. All Rights Reserved.
The Rogue Wave name and logo, and Stingray, are registered trademarks of Rogue Wave Software. All other trademarks are the property of their respective owners.
Provide feedback to Rogue Wave about its documentation.