
The Statistical chart analyzes the user's data and then graphically displays the data distribution. The user provides the raw data. The OCUT performs the analysis and draws the chart according the user's settings. The Statistical chart is encapsulated in the OCStatistic class in the OCUT library.
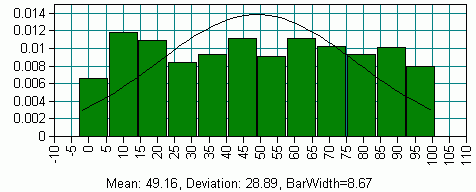
Internally, the Statistical chart maintains five groups of data. The first group is the raw input data. The second and the third groups are the results of the analysis of the input data, which is performed in the function OCStatistic::ProcessData(). These two groups are used to draw the chart on the display area. The data values in the fourth and fifth groups describe a Normal distribution with mean and standard deviation equal to the mean and standard deviation of the input data. These last two groups are used to draw a reference curve for comparison with the distribution of the input data. The appearance of this reference curve is controlled by the function SetShowNormal().
Because the Statistical chart is typically used to analyze a large quantity of input data, OCStatistic uses the Structure data storage model. However, the complexities of the Structure data model are hidden from the user by this class. Just put the input data in a buffer and pass a pointer to the buffer to the SetData() function.
You don't even have to create the input data buffer. Just tell SetData() how big the data buffer needs to be, and use SRGraph::SetValue() to supply the data values to the internal SRGraph object. In this case, all the data buffers are handled entirely by the class.
By default, the chart of the data distribution is drawn as a bar graph with an XYScatter axis. The Normal reference curve is drawn as a line. The width of the bars is specified by the value of m_dStep times the standard deviation (STD) of the data. The default value of m_dStep is 1.0. A different (usually smaller) value can be specified by calling SetStep().
The number of bars on each side of the mean is specified by m_nDivision, which is specified by SetDataDivision(). Therefore the range covered by the Statistical chart is 2*m_nDivision*m_dStep*STD.
To set up a Statistical chart:
Create an OCStatistic object somewhere.
Create a data buffer (optional).
Initialize the data buffer with your data.
Call SetData() to put the data into your OCStatistic instance.
Call SetupComponent() to create the default component for the internal SRGraph instance.
Call SetStep() to set m_dStep.
Call SetDataDivision() to set the number of divisions for the histogram.
Finally, call ProcessData() to perform the analysis.
In your OnDraw() function call the DrawComponentList() function of OCStatistic's internal SRGraph object.
For example:
// create an OCStatistic object somewhere in the app
OCStatistic m_StatChart;
// set up the Statistical chart
m_StatChart.SetupComponents();
// construct the data buffer
m_nInBufSize = 3330;
m_nOutBufSize = 20;
m_pInStruct = new double[m_nInBufSize];
m_StatChart.SetData(m_nInBufSize, m_pInStruct);
// or let OCUT construct the buffer
//  m_StatChart.SetData(m_nInBufSize, NULL);
// initialize the buffer with raw data
srand((unsigned int)time(NULL));
for(int i= 0; i < m_nInBufSize; i++)
{
    // in our buffer
    m_pInStruct[i] = rand() % 100;
    // or in OCUT's automatic buffer
    // GetGraph()->SetValue(i, 0, rand()%100);
}
// set the step size and number of steps
m_StatChart.SetStep(1.0);
m_StatChart.SetDataDivision(m_nOutBufSize/2);
// perform the analysis
m_StatChart.ProcessData();

...

// in the view class's OnDraw(CDC* pDC) function
CString s;
s.Format(_T("Mean: %.2f, Deviation: %.2f, BarWidth=%.2f"),
      m_StatChart.GetMean(),
      m_StatChart.GetDeviation(),
      m_StatChart.GetStep()*m_StatChart.GetDeviation());
m_StatChart.GetGraph()->SetGraphTitle(s);
m_StatChart.GetGraph()->DrawComponentList(pDC, this);
}
|
Figure 134 shows an example of a Statistical chart.
Copyright © Rogue Wave Software, Inc. All Rights Reserved.
The Rogue Wave name and logo, and Stingray, are registered trademarks of Rogue Wave Software. All other trademarks are the property of their respective owners.
Provide feedback to Rogue Wave about its documentation.