Rogue Wave Views 5.6
Rogue Wave Views
Charts Package API Reference Guide
Rogue Wave Views
Documentation Home
 Rogue Wave Views 5.6 |
Rogue Wave Views |
Rogue Wave Views Documentation Home |
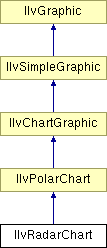
Implementation of radar charts. More...
#include <ilviews/charts/radar.h>

Public Member Functions | |
| IlvRadarChart (IlvDisplay *display, const IlvRect &bbox, IlBoolean useGrid=IlFalse, IlvPalette *palette=0, IlvPalette *gridPalette=0) | |
| Constructor. | |
| virtual IlBoolean | addDisplayer (IlvAbstractChartDisplayer *displayer, IlUInt count, IlvChartDataSet *const *dataSets, IlvCoordinateInfo *ordinateInfo=0, IlUInt position=IlvLastPositionIndex) |
| Adds a displayer connected to several data sets. | |
Implementation of radar charts.
Library: ilvcharts
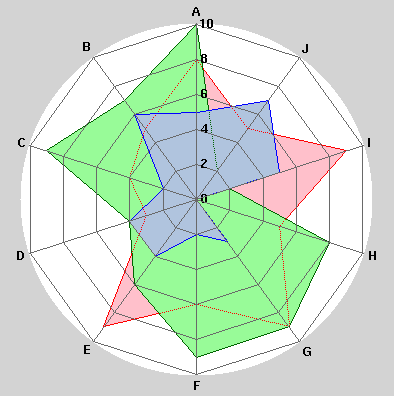
Example of a radar chart:

| IlvRadarChart::IlvRadarChart | ( | IlvDisplay * | display, | |
| const IlvRect & | bbox, | |||
| IlBoolean | useGrid = IlFalse, |
|||
| IlvPalette * | palette = 0, |
|||
| IlvPalette * | gridPalette = 0 | |||
| ) |
Constructor.
Initializes a new IlvRadarChart object. The constructor creates a polar chart with two default scales. The associated projector is an instance of IlvPolarProjector initialized with startingAngle and range. The abscissa scale is an instance of IlvCircularScaleDisplayer and the ordinate scale is an instance of IlvRectangularScaleDisplayer.
0. Otherwise it must represent the angle range within which the data will be projected on the screen. See the IlvPolarProjector class for more details.| display | The display connection that will handle the drawing of this object. | |
| bbox | The initial bounding box of the chart graphic. | |
| useGrid | A Boolean indicating whether grids should be added to created scales. | |
| startingAngle | The starting angle of the associated polar projector. | |
| range | The range of the associated polar projector. | |
| orientedClockwise | A Boolean indicating whether the projector should be oriented clockwise (IlTrue) or counter-clockwise (IlFalse). | |
| palette | The palette associated with the chart. | |
| gridPalette | The palette associated with the grids. (This is meaningful only if useGrid is equal to IlTrue). |
| virtual IlBoolean IlvRadarChart::addDisplayer | ( | IlvAbstractChartDisplayer * | displayer, | |
| IlUInt | count, | |||
| IlvChartDataSet *const * | dataSets, | |||
| IlvCoordinateInfo * | ordinateInfo = 0, |
|||
| IlUInt | position = IlvLastPositionIndex | |||
| ) | [virtual] |
Adds a displayer connected to several data sets.
A displayer is used to render one or several data sets that are part of the chart data object used by the current chart graphic. A chart graphic can be rendered using multiple displayers.
| displayer | The displayer to add to this chart graphic. | |
| count | The number of data sets that this displayer must render. | |
| dataSets | An array of count pointers to the data sets that must be displayed by displayer. Note that all the indicated data sets must belong to the chart data object used by the current chart graphic. | |
| ordinateInfo | The coordinate information object associated with the ordinate scale that this displayer must follow. If this parameter is omitted or set to 0, the displayer will be connected to the main (the first) ordinate scale. If this parameter is not 0, then ordinateInfo must be one of the coordinate information objects associated with an ordinate scale of the chart graphic. | |
| position | The index of the new displayer. If this parameter is not specified, or set to IlvLastPositionIndex, this displayer becomes the last of that chart graphic. A value of 0 indicates that the displayer becomes the bottom-most displayer (that is, the first to be displayed). |
IlTrue, that the new displayer was successfully added. If this method returns IlFalse, then there was a problem, and an error message was produced. Reimplemented from IlvChartGraphic.
© Copyright 2012, Rogue Wave Software, Inc. All Rights Reserved.
Rogue Wave is a registered trademark of Rogue Wave Software, Inc. in the United States and other countries. All other trademarks are the property of their respective owners.