
Rogue Wave Views 5.6
Rogue Wave Views
Charts Package API Reference Guide
Rogue Wave Views
Documentation Home
Rogue Wave Views 5.6 |
Rogue Wave Views |
Rogue Wave Views Documentation Home |
Implementation of predefined polar charts. More...
#include <ilviews/charts/simplegr.h>
Public Member Functions | |
| IlvPolarChart (IlvDisplay *display, const IlvRect &bbox, IlBoolean useGrid=IlFalse, IlDouble startingAngle=0.0, IlDouble range=0.0, IlBoolean orientedClockwise=IlFalse, IlvPalette *palette=0, IlvPalette *gridPalette=0) | |
| Constructor. | |
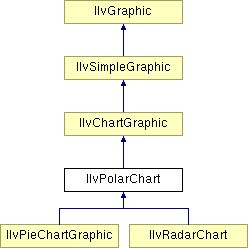
Implementation of predefined polar charts.
Library: ilvcharts
This class is a subclass of IlvChartGraphic which allows you to display a polar chart.
A polar chart represents data in a circular way: the data are expressed in polar coordinates (theta, rho). The abscissa values theta are mapped along a circular scale. The ordinate scales which represent the rho coordinate are radial.
Example of a polar chart:
IlvChartGraphic. | IlvPolarChart::IlvPolarChart | ( | IlvDisplay * | display, | |
| const IlvRect & | bbox, | |||
| IlBoolean | useGrid = IlFalse, |
|||
| IlDouble | startingAngle = 0.0, |
|||
| IlDouble | range = 0.0, |
|||
| IlBoolean | orientedClockwise = IlFalse, |
|||
| IlvPalette * | palette = 0, |
|||
| IlvPalette * | gridPalette = 0 | |||
| ) |
Constructor.
Initializes a new IlvPolarChart object. The constructor creates a polar chart with two default scales. The associated projector is an instance of IlvPolarProjector initialized with startingAngle and range. The abscissa scale is an instance of IlvCircularScaleDisplayer and the ordinate scale is an instance of IlvRectangularScaleDisplayer.
0. Otherwise it must represent the angle range within which the data will be projected on the screen. See the IlvPolarProjector class for more details.| display | The display connection that will handle the drawing of this object. | |
| bbox | The initial bounding box of the chart graphic. | |
| useGrid | A Boolean indicating whether grids should be added to created scales. | |
| startingAngle | The starting angle of the associated polar projector. | |
| range | The range of the associated polar projector. | |
| orientedClockwise | A Boolean indicating whether the projector should be oriented clockwise (IlTrue) or counter-clockwise (IlFalse). | |
| palette | The palette associated with the chart. | |
| gridPalette | The palette associated with the grids. (This is meaningful only if useGrid is equal to IlTrue). |
© Copyright 2012, Rogue Wave Software, Inc. All Rights Reserved.
Rogue Wave is a registered trademark of Rogue Wave Software, Inc. in the United States and other countries. All other trademarks are the property of their respective owners.

