Reconfiguring your data
Explains how to change the data and the mapping for an existing chart.

Describes the aspects of the data associated with the chart that can be changed.
Explains how to change the SQL query for activities to retrieve extra data.
Describes how to make use of extra data in your diagram by mapping it.
Explains the stages necessary to style DRE doc activities.
Changing data aspects
The data for a Gantt chart is set up when you load and map data in the New Gantt Chart Wizard or open a template. The Designer lets you change the data loaded and the mapping for an existing chart.
If you have an existing chart and you want to include further data from the same data source, or try out a new data set, you can reconfigure the data associated with the chart.
You can change the following aspects of the data associated with the chart:
The data file
The data mapping
If you have changed the data file, you must define a new mapping. If you have the same data file, you can change the mapping anyway, for example, to load extra data.
This section reconfigures the data for the
harbor1 activity-oriented chart; see
Loading data from a database. It assumes that you have decided to make a new version of the chart that includes the dock and turnaround time, with the activities for the DRE dock displayed showing this time.
First choose File > Open and browse to select the harbor1.igpr project file.
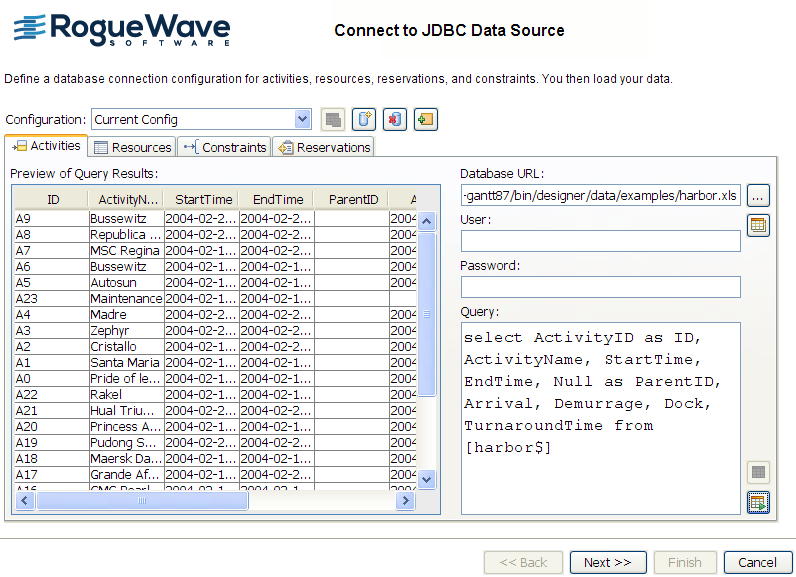
Choose Data > Reconfigure Data. The Reconfigure Data Wizard opens at the Gantt Connect to JDBC Data Source page.
Data connection configuration
The displayed information reflects the current configuration.
To change the SQL query for activities to retrieve extra data:
1. Add Dock and TurnaroundTime to the columns to retrieve.
2. Click Execute Query to load the data and see the new column in the Preview.
The following figure shows the reconfiguring data: additional columns.
3. 
4. Click Next.
Data mapping
To make use of the extra data in your diagram, you need to map it. In this example, the properties Dock and TurnaroundTime have been automatically created and mapped to the Dock and TurnaroundTime columns.
To exit the wizard:
Click
Finish.
Styling the DRE dock activities
To style the DRE dock activities:
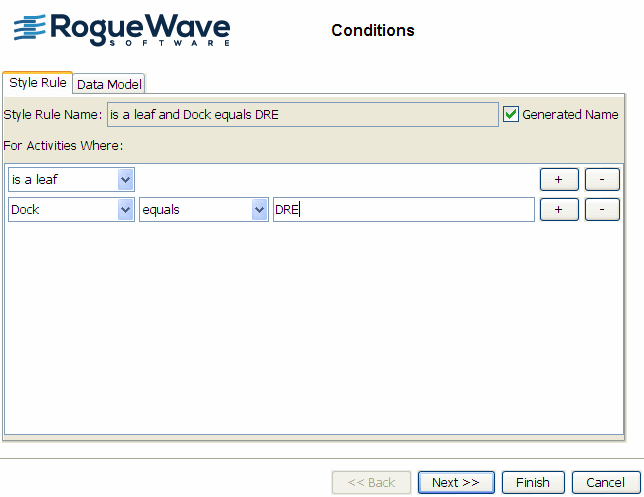
1. Select the activity:leaf rule.
2. Click Edit > Create Style Rule.
3. Create a rule on the DRE dock.
The following figure shows a style rule on the additional attribute.
4. 
5. Click Next and select the New renderer option.
6. Click Next.
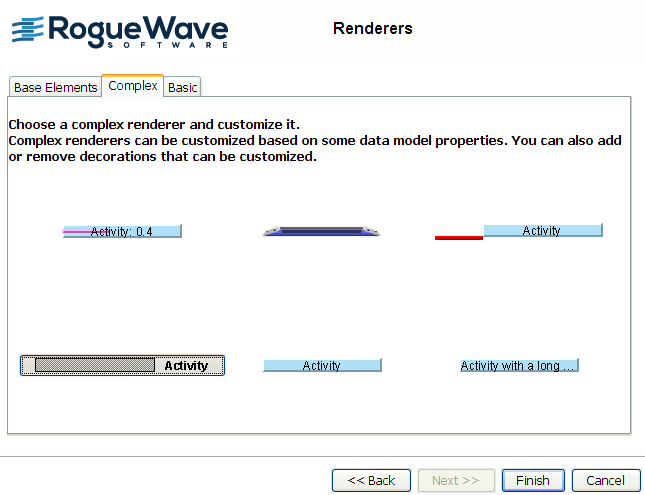
7. In the Renderers page, Complex tab, select the activity bar with SVG and text.
This complex renderer will allow you to select a different vector image (SVG format) and to customize the associated text.
The following figure shows the selection of the complex renderer for an activity bar with SVG and text.
8. 
9. Click Finish.
10. With the new rule selected under Style Rules:
a. In the Styling Customizer select the Graphic tab
b. Customize the Renderers as follows:
c. Select the SVG element and browse to select an SVG file of your choice.
d. Select the Text element and modify the default value for the Label to the value of the turnaround time instead of the value of the name, by entering @turnaround.
11. To save the new chart:
a. Click File > Save As.
12. Enter the name harbor2 for the project.
Copyright © 2018, Rogue Wave Software, Inc. All Rights Reserved.
