Loading data from a database
Describes the tasks necessary to load data from a database.

Explains the steps necessary to load data through JDBC.
Describes how to load data using the New Gantt Chart Wizard.
Explains how to define the mapping between the properties in the Gantt data model and the columns of the tables.
Overview
JViews Gantt lets you connect to a database to load data through JDBC. You can connect, for example, to a Microsoft® Access or an Oracle® database, or to a Microsoft® Excel or a Microsoft® Project file. The use case is based on data from the Microsoft® Excel file
harbor.db. The data is the same as in harbor.csv (see the use case in
Loading data from a flat file), but in this use case you will split the data into three tables with SQL queries.
In this section you will:
Create a chart from basic elements.
Choose a JDBC data source.
Create a new database configuration and use
harbor.db to provide the data.
Perform an SQL query for each data type to fill each table.
Map the database columns to graphic properties of activities.
Create new properties and map them to the appropriate columns.
The mapped properties can be used for styling your data by creating style rules that refer to the properties.
Accessing the data
Load the data from the New Gantt Chart Wizard.
If your data is in a local file, you will not need to enter a user name and password. If your data is in a database, the Database Administrator can provide the information.
1. Start the New Gantt Chart Wizard, for example, by choosing File > New From Wizard.
2. Select Start From Basic Elements and click Next.
3. Select Database (JDBC) as data source type and click Next.
4. Create a new database configuration by clicking the
5. 
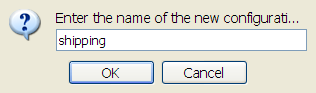
6. sign. Type the name shipping and click OK.
The following figure shows how to name a new configuration.
7. 
8. For the database URL, click the Ellipsis button and select the database for the harbor example, harbor.db.
This operation provokes an error because you need to formulate an appropriate SQL query for the file type and content.
9. Click the Copy sign
10. 
11. to reuse the same database URL for the other tables, since all the data is in the same file.
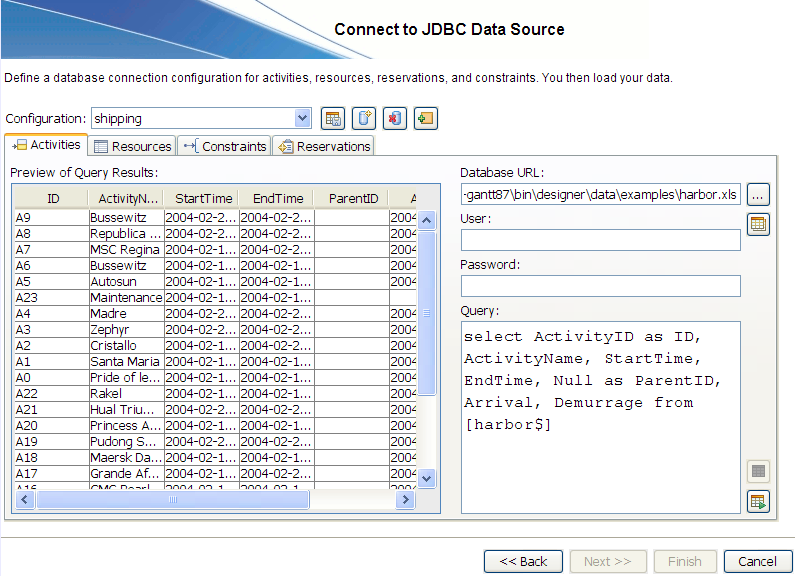
12. With the Activities tab active, formulate an SQL query by typing:
select ActivityID as ID, ActivityName, StartTime, EndTime, Null as ParentID,
Arrival, Demurrage from [harbor$]
This query names the table columns in the Designer and determines their content. For example, the content of the ActivityID column in the data file is written to ID. The column headed ParentID is set to null and therefore appears empty; this is necessary because there is no data for ParentID in the data file. The remaining columns are named as in the data file. This data is taken from the Microsoft® Excel page named harbor.
13. Click the execute query sign to execute the query
14. 
15. .
The following figure shows the result of the activity query.
16. 
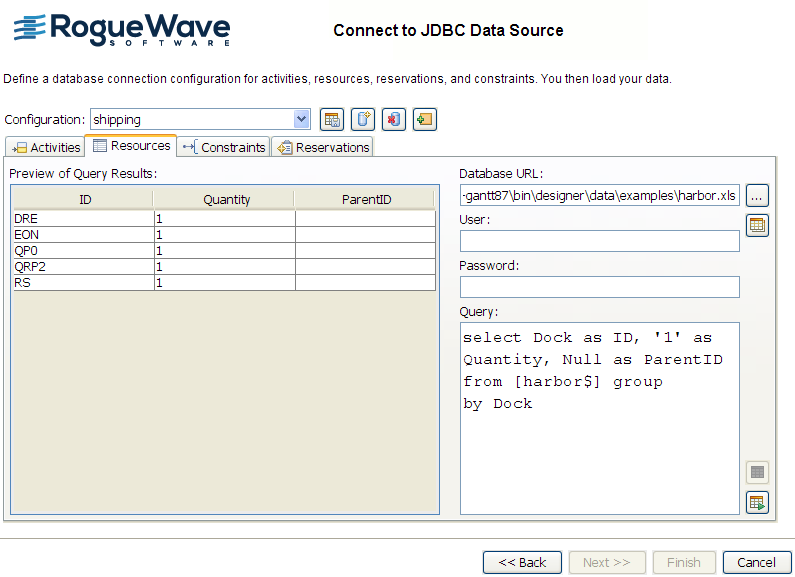
17. Select the Resources tab and formulate the query:
select Dock as ID, '1' as Quantity, Null as ParentID from [harbor$] group
by Dock
18. Click the execute query sign to execute the query
19. 20. .
In this use case, unlike the previous one, the dock is represented as a resource. The resource data is aggregated ( group by clause) so that each dock only appears once.
The following figure shows the result of the resource query.
21. 
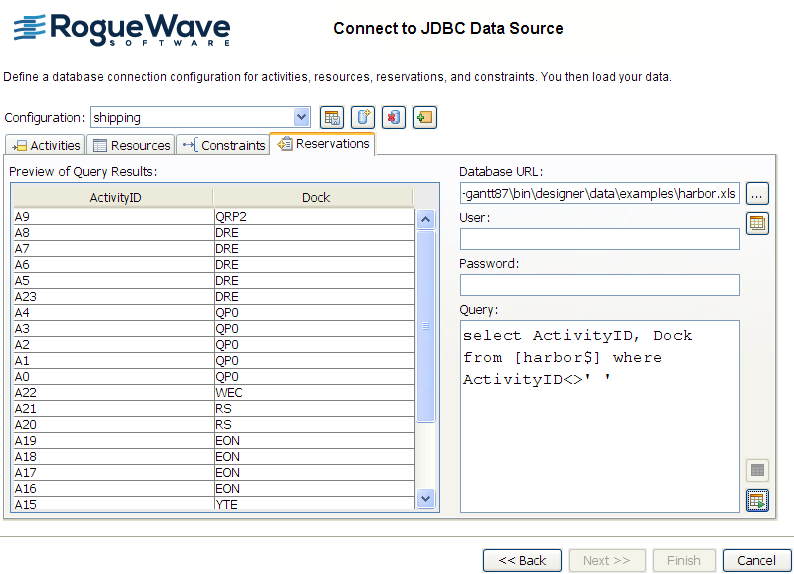
22. Select the Reservations tab and formulate the query:
select ActivityID, Dock from [harbor$] where ActivityID<>' '
23. Click the execute query sign to execute the query
24. 25. .
The data loaded excludes any rows where the Activity ID is blank, indicating the dock is not in use ( where clause).
The following figure shows the result of the reservation query.
26. 
27. Select the Constraints tab and delete the query because you do not want any constraints loaded.
28. Click the execute query sign to execute the empty query
29. 30. .
31. Click Next to access the data-mapping facilities.
Mapping the data
You need to define the mapping between the properties in the Gantt data model and the columns of the tables. Properties that are unmapped and mandatory are shown with a red exclamation mark.
Mapping properties to the Activities Table
See in
Mapping the predefined properties for how to map the predefined property
name to the corresponding column. Note that in this case
id is mapped to
ID.
In this example, the columns Arrival and Demurrage in the Activities Table define additional attributes that do not correspond to any properties in the Gantt data model, however, the user-defined properties Arrival, and Demurragehave been automatically created and mapped to these columns.
Select the
nameproperty and click the
ActivityName column or column header to create the mapping.
The properties you have mapped allow you to display the following in a Gantt chart:
The tasks to be carried out on specific ships
The duration of these tasks
The arrival time of each ship
The cost of mooring the ship
Mapping properties to the Resources Table
In the Resources Table, you only need to map thename property. The other properties required have been automatically created and mapped to the corresponding columns.
Select the
nameproperty and then click the
IDcolumn or column header to create the mapping.
The resources are the docks where ships will be moored. The capacity of each dock is just one activity ( quantity is always 1 ).
Mapping properties to the Reservations Table
In the Reservations Table, you only need to map theresourceID property. The other properties required have been automatically created and mapped to the corresponding columns.
1. Select the resourceID property and then click the Dock column or column header to create the mapping.
Reservations link an activity to a resource. An activity is a task, which in this example consists of performing an operation such as loading, unloading, or repairing a named ship during a specified time. This task is carried out at a specified dock resource.
2. Click the Save Configuration sign
3. 
4. to save the database configuration for reuse between projects.
If you want to reuse your data connection configuration in projects other than the current one, use the Save Configuration icon.
If the configuration is for use in the current project only, you do not need to use this icon to save it. It is automatically saved when you save the project.
The Rogue Wave predefined connections cannot be saved by clicking the icon. In the case of a predefined connection, the Save Configuration icon is disabled.
5. Click Next to choose the type of chart and then to choose a theme.
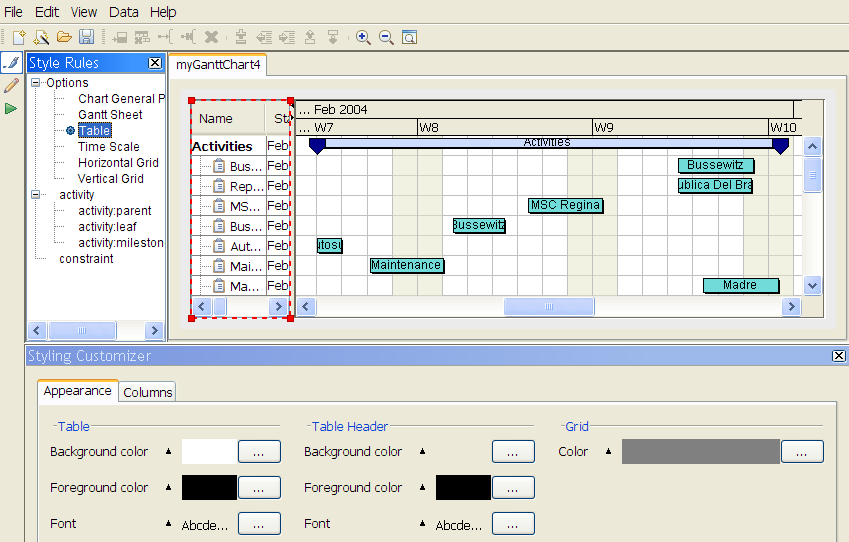
6. Click Finish to view the data in a basic Gantt chart, shown in the following figure.
To save this chart, choose File > Save As and enter harbor1 as the name of the project file.
The following table shows an activity-oriented chart showing the harbor data.
Copyright © 2018, Rogue Wave Software, Inc. All Rights Reserved.