Loading data from a flat file
Describes the tasks necessary to load data form a flat file.

Describes the tasks necessary to load data from a text file with the extension
.csv.
Explains how to load data using the New Gantt Chart Wizard.
Describes how to define the mapping between the properties in the Gantt data model and the columns of the tables in a file.
Overview
JViews Gantt lets you load data from a text file with the extension .csv (comma separated values). The value separator does not have to be comma (,). The Designer recognizes the following separators: comma, semicolon (;), space, or tab. The use case is based on data from the file harbor.csv.
In this section you will:
Create a chart from basic elements.
Choose a flat file data source and use
harbor.csv to provide the data.
Map the predefined properties recognized in the Gantt data model to columns in the Activities Table.
Create new properties and map them to the appropriate columns.
The mapped properties can be used for styling your data by creating style rules that use the properties.
Accessing the data
Load the data from the New Gantt Chart Wizard.
1. Start the New Gantt Chart Wizard, for example, by using the key sequence Ctrl-w.
2. Select Start From Basic Elements and click Next.
3. Select the option Flat File by clicking Next.
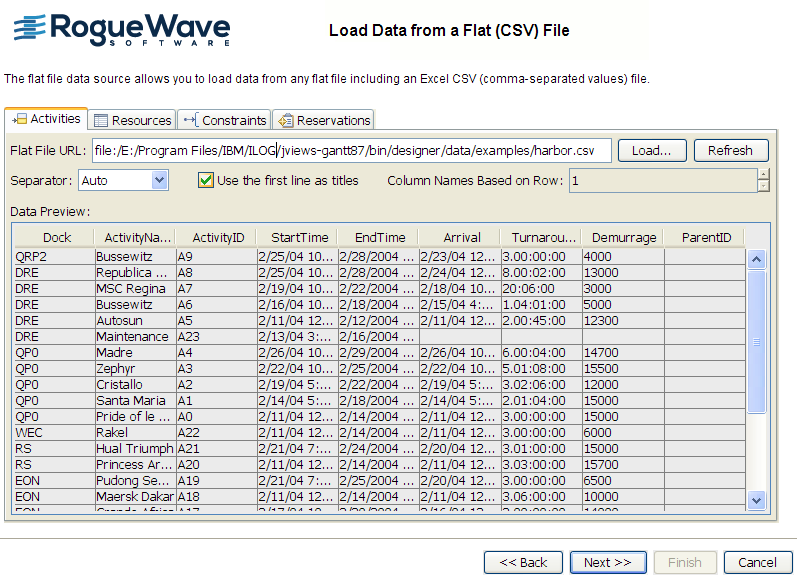
4. Select and open the file harbor.csv.
The data in this file is displayed in the Activities Table.
Note that the separator value is set to auto. This setting allows the separator used in the flat file to be identified automatically, provided that it is one of the four allowed selectors. The separator used in harbor.csv is the semicolon (;). Use of the auto setting means that you do not have to select the semicolon explicitly before loading the file.
The following figure shows the Activities Table from harbor.csv.
5. 
6. Click Next to access the data-mapping facilities.
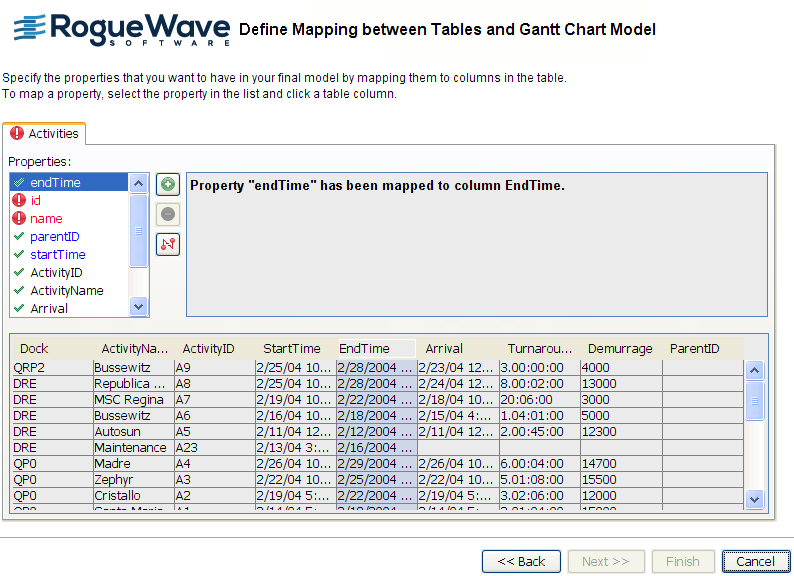
Mapping the data
You need to define the mapping between the properties in the Gantt data model and the columns of the tables in the file. This mapping is done automatically whenever possible. The table columns from the data source you select are matched against the properties in the Gantt model and if a property with the same name exists they are mapped. If a given property is not found, one with the same name as the column is added and automatically mapped.
In this example, you will map predefined properties to columns in the Activities Table. Properties that are unmapped and mandatory are shown with a red exclamation mark. If required, you can create user-defined properties and map them to other columns in the Activities Table.
The following figure shows how to define a mapping.
Mapping the predefined properties
1. To map a property to a column, select the property and click the column or the column header you want to map it to. The name of the property turns blue when it has been mapped.
An activity is defined by the following properties:
parentID id name
startTime
endTime
Activities are hierarchical in the Gantt data model. The hierarchy unfolds from the
root activity, so that each activity shown in a chart has a
parent activity and can in turn be a parent of another activity, unless it is a
leaf activity, which has no child activities. Therefore, each activity except the root activity can be associated with the ID of its parent activity.
2. In this example you only need to map the following properties:
Gantt Data Model | Flat File Activities Table |
id | ActivityID |
name | ActivityName |
Creating user-defined properties and mapping them
There can be columns in the Activities Table that define additional attributes that do not correspond to any properties in the Gantt data model. You can create user-defined properties for mapping to these columns. In this example, the user-defined properties Dock, Demurrage, Arrival, and TurnaroundTime have been automatically created and mapped to the corresponding columns.
If you need to create other user-defined properties to match other columns in the table, add them as follows:
1. Click the large plus sign just to the right of the list of properties

.
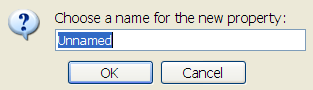
The following figure shows how to create a user-defined property.
2. Type the name of the property, for example, Dock and click OK.
3. Select the newly created property Dock and click the column or column header that you want to map it to, in this case, Dock.
4. If you make a mistake creating a property, click the large minus sign to remove it

.
5. If you map a property incorrectly, click the clear mapping sign to undo the mapping

.
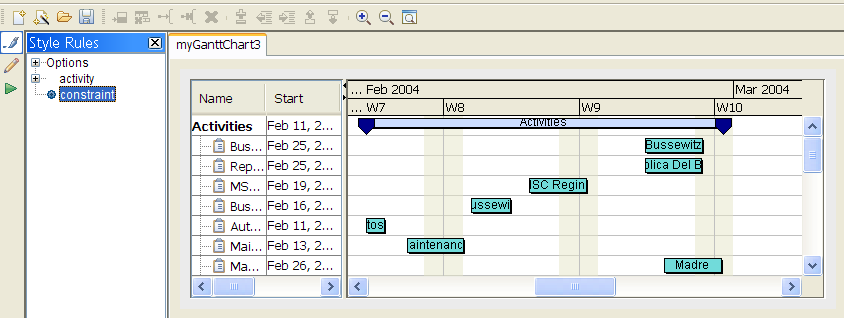
You have mapped all the properties needed to define an activity for the data in harbor.csv. Click Finish to select the type of chart and theme, and then to display the Gantt chart you have created and the data that it contains.
The following figure shows the Gantt chart with activity data from harbor.csv.
There are no constraints mapped for the data in
harbor.csv, so you can
only expand the style rules for activity data. You can style the data by using the mapped properties in style rules. See
Creating style rules.
Copyright © 2018, Rogue Wave Software, Inc. All Rights Reserved.