Working in different modes
Describes the different working modes available in the Designer.

Describes the three available working modes.
Explains how you use the Style Editing mode to modify a chart and the underlying data model.
Explains how you use the Gantt Chart Editing mode to modify a chart and the underlying data model.
Explains how you use Preview mode to interact with a chart.
Overview
You can work in the following modes:
There are specific default interactions associated with each mode. In all modes you can zoom in and out.
Style editing mode
To enter Style Editing Mode, click the top icon in the vertical toolbar. In this mode you can select a rule under Style Rules or select a chart component or data object in the chart and specify the styling.
You can customize the styling of chart components through their associated customizers. See
Customizing Gantt chart options.
You can style data by writing style rules. These rules are written by creating or changing style rule conditions and associating them with a renderer. You can do this in the Create Style Rule Wizard or the Change Style Rule Wizard. See
Creating style rules and
Changing the style rule. The condition represents the expressions in the left part (the
selector) of a CSS style rule. The rendering represents the right part of a CSS style rule.
The style rules define the styling used in the style sheet which is the CSS file used by a project in the Designer.
When you write style rules, you can choose to apply the renderer inherited from a more generic related rule higher in the style rule hierarchy or you can choose a new renderer that applies only to the more specific context defined by the style rule condition. You can define the new renderer by choosing one of the default renderers supplied in the Designer and customizing it in the Styling Customizer.
Viewing the data model in Style Editing Mode
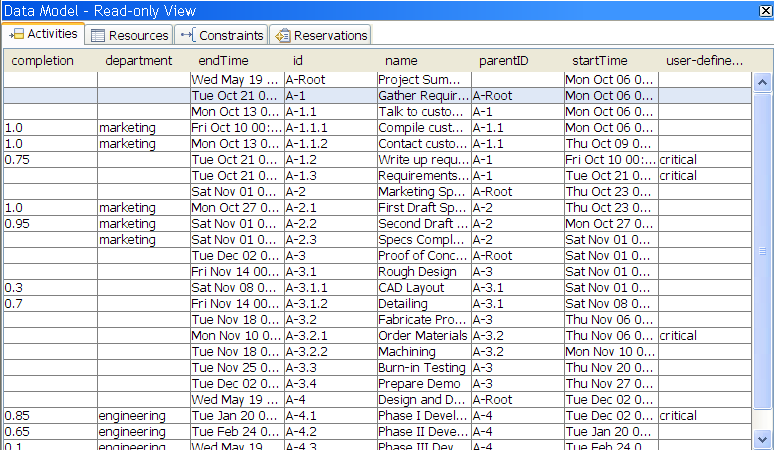
You can display a read-only view of the data model by choosing View > Data Model. When the Data Model option is checked the Data Model — Read-only View is displayed by default in a pane below the Gantt chart. This panel is dockable in any position within the main panel or can be a separate window.
The following figure shows a read-only view of the data model in Style Editing Mode.
Use the tabs to view the different object types (Activities, Resources, Constraints, and Reservations) in the data model.
Gantt Chart editing mode
To enter Gantt Chart Editing mode, click the second icon in the vertical toolbar. In this mode you can modify the chart and the underlying data model. You can insert and delete activities or resources and create constraints or reservations. You can indent and outdent data objects and move them up or down in the hierarchy.
In this mode, you cannot change the styling of objects.
In this mode, you can expand the data nodes and scroll vertically and horizontally, so that all nodes can be visible. (See
expanded data node and
visible data node.) It is easier to see leaf activities or resources in this mode than in Style Editing Mode.
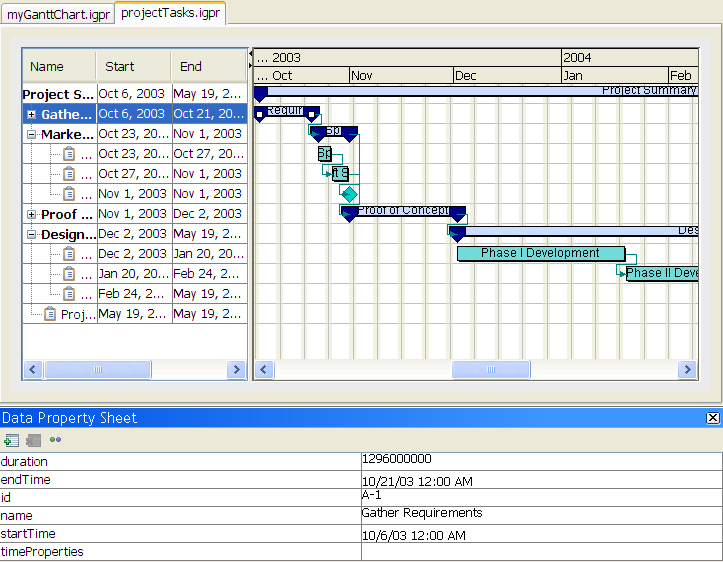
Selecting an object in the Gantt Sheet (activities or constraints in a Gantt chart; resources or reservations in a Schedule chart) displays the properties of this object in the Data Property Sheet. The following figure shows the activity Phase 1 Development selected in the Gantt Sheet (upper right pane) and the properties of this activity in the Data Property Sheet (lower pane).
The Data Property Sheet is also visible in Style Editing Mode.
You can then remove, add, or modify some of the properties.
NOTE Note that some properties are not editable.
Adding a user-defined type
To add a user-defined type:
1. Select an object.
2. Click the Set User-Defined Type button in the toolbar of the Data Properties Sheet.
3. Enter new values for the properties of the user-defined type.
If you want to enter multiple values, separate each value in the list by a comma.
User-defined types are identified by the value of the
tags property. See
User-defined properties.
Adding a data property
To add a new property to an object:
1. Click the New Property button in the toolbar of the Data Properties Sheet.
2. Enter the name of the property and its value.
Values can only be primitive values.
Removing a property
To remove a property of an object:
1. Select the property in the Data Property Sheet.
2. Click the Delete Property button in the toolbar.
Preview mode
This icon in the vertical toolbar represents Preview Mode. In this mode you can interact with the chart and its objects using the interactors zoom in, zoom out, or zoom to fit to see the dynamic effects your style rules will have in your application.
In this mode, you cannot change the styling of objects or the data in the chart.
Copyright © 2018, Rogue Wave Software, Inc. All Rights Reserved.