Switching to 3-D
Describes how to switch between a 2-D and a 3-D representation.

Describes the methods involved in the 3-D representation.

Describes the properties accessible through the 3-D view.

Describes how to interactively control the 3-D view orientation.
3-D view methods
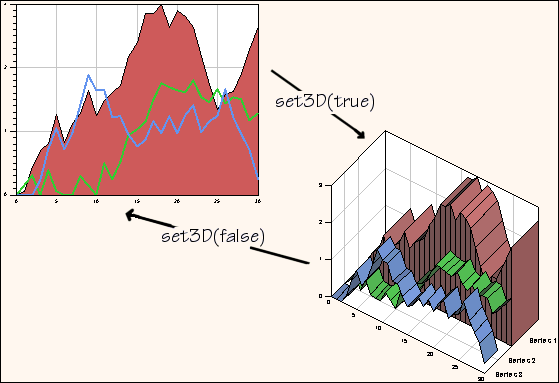
With the JViews Charts library, you can switch between a 2-D and a 3-D representation by simply calling the
set3D method. This method does not alter the structure of the chart. The chart components (header, footer, legend) and the chart elements (renderers, scales, grids, decorations, and so on) remain unchanged.
You can dynamically call this method on an existing chart, as shown in
Switching Between 2-D and 3-D.
Switching Between 2-D and 3-D
The
is3D method indicates whether the chart is displayed in 3-D.
NOTE Only Cartesian and Pie charts support 3-D rendering. Calling
IlvChart.set3D on a chart that does not support this mode (for example, a Radar chart) does not raise an error, but the visual appearance of the chart will not change. Likewise, if you switch between a 3-D Cartesian chart and a Polar chart with the
setType method, the polar representation will be made in 2-D. You can find a list of the available 3-D capabilities in the section
Supported features.
The 3D rendering features are shown in the sample located in
<installdir>/jviews-charts/samples/chart3d/index.html.
3-D view properties
The
IlvChart3DView class represents the three-dimensional view of the chart and lets you control its visual appearance. You can retrieve the view associated with a chart by calling the
IlvChart.get3DView method.
NOTE The
get3DView method returns a valid
IlvChart3DView object, even if the chart is not currently displayed in 3-D. You can thus switch between a 3-D and a 2-D representation, and still keep the properties of the 3-D display.
Projection properties
The following properties specify how points are projected in the chart view.
Property | Methods | Default Value |
Elevation | getElevation setElevation | 45 |
Rotation | getRotation setRotation | 35 |
Automatic Scaling | isAutoScaling setAutoScaling | true |
Zooming Factor | getZoom setZoom | 1 |
Projection Type | getProjectionType setProjectionType | IlvChart3DView.ORTHOGRAPHIC |
View angles
The elevation and rotation angles specify the location of the eye. The elevation ranges from –90 degrees to 90 degrees. The rotation angle ranges from –90 degrees to 90 degrees for Cartesian charts and can take any value for Pie charts. A dedicated interactor lets you modify these angles, as described in the section
Interactive control of the 3-D view orientation.
Scaling factor
The scaling applied to the x- and y-coordinates during projection is computed as follows: if the autoScaling property is set to true, the chart tries to determine the appropriate scaling factor so that the drawing fits the rectangle of the chart area. The computed scaling factor is then multiplied by the zooming factor.
Projection type
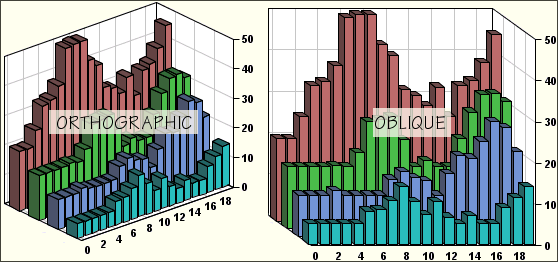
Two projection types are available for Cartesian charts:

Orthographic projection (
IlvChart3DView.ORTHOGRAPHIC ).

Oblique projection (
IlvChart3DView.OBLIQUE ). This projection preserves the orthogonality of x- and y-axes.
Orthographic and Oblique Projections shows the difference between the two projection types.
Orthographic and Oblique Projections
Lighting properties
The following properties specify how lighting is shown in the chart view.
Property | Methods | Default Value |
Ambient light intensity | getAmbientLight setAmbientLight | 0.1 |
Light latitude | getLightLatitude setLightLatitude | 0 |
Light longitude | getLightLongitude setLightLongitude | 0 |
The JViews Charts library uses a simple lighting model composed of:

A direct light, which casts parallel rays. This light is located by spherical coordinates in the projected space. The default latitude and longitude are equal to 0, which means that the light is originally located at the eye.

An ambient light, which illuminates all the objects of a 3-D view, independently of the orientation of the rendered faces. Changing the intensity of this light prevents some parts of the chart from being too dark. The intensity ranges from 0 (no ambient light) to 1 (maximum intensity).
Controlling depth
The following properties control depth in the chapter view.
Property | Methods | Default Value |
Depth | getDepth setDepth | 20 |
Depth gap | getDepthGap setDepthGap | 0 |
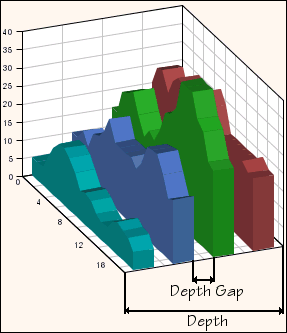
The depth property ranges from 1 to 100 and specifies the percentage of the chart depth relative to its width. The depth gap lets you control the separation between two layers, as shown in
Controlling the Depth of a Chart.
Controlling the Depth of a Chart
Decorations along the depth axis
The chart can display annotations and grid lines along the z-axis (also referred to as the depth axis).
The annotations are returned by the
getZAnnotationText method. You can control the visibility and the appearance of annotations and grid with the following properties:
Property | Methods | Default Value |
z-annotation visibility | isZAnnotationVisible setZAnnotationVisible | true |
z-annotation renderer | getZAnnotationRenderer setZAnnotationRenderer | |
z-grid visibility | isZGridVisible setZGridVisible | true |
z-grid paint | getZGridPaint setZGridPaint | Paint of x- or y-grid |
z-grid stroke | getZGridStroke setZGridStroke | Stroke of x- or y-grid |
Listening to property changes
The
IlvChart3DView class enables you to add listeners that are notified whenever a property is modified. The registration and notification use the
PropertyChangeListener and
PropertyChangeEvent classes from the
java.beans package. The
ControlPanel3D.javasource file shows how listeners can be used to synchronize slider controls with the values of numeric properties.
Interactive control of the 3-D view orientation
The
IlvChart3DViewInteractor class allows the user to interactively control the rotation and elevation angles of the view, as well as the zooming factor. This interactor can be connected to a chart as any regular chart interactor, using the
addInteractor method:
chart.addInteractor(new IlvChart3DViewInteractor())
The IlvChart3DViewInteractor class provides the following interactions:

You can change the rotation angle (horizontal move) or the elevation angle (vertical move) by holding the CTRL key and dragging with the left mouse button.

You can change the zoom factor (zoom-out for an upward move, and zoom-in for a downward move) by holding the SHIFT key and dragging with the left mouse button.
The event masks can be specified in the constructor of the interactor, or changed with the
setAngleEventMask and
setZoomEventMask methods.
Copyright © 2018, Rogue Wave Software, Inc. All Rights Reserved.


