Perforce JViews Charts Sample: Using 3-D Effects (SDK)
Description
 |
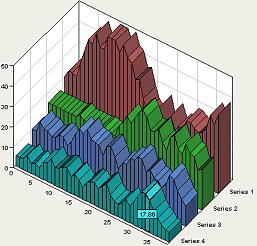
This sample shows the available 3-D representations.
3-D charts are fancier than plain 2D charts. Note that 3D pie charts and 3D polyline charts can easily convey wrong information to the human eye: in a 3-D pie chart, slices that lie on the front half of the circle appear larger; in a 3-D polyline chart, the top and down sides of a particular angle are emphasized. Similarly, a stacked 3-D bar chart can be fallacious: it emphasizes the top slice of each bar, even if this slice is numerically irrelevant. For these reasons, 2-D charts are still more used than 3-D charts. Bar charts, polyline charts and filled area charts are primarily used to show trends. To display a value over time, the preferred choice is a polyline chart. To display accumulating value over time (such as interests or consumption), the preferred choice is a filled area chart; a polyline chart is also possible. A bar chart is used when the data set is small, namely composed of 5 values or less.
How to Use the Sample
-
The top of the panel contains several controls to change the data and to
switch between the available representations:
- A combo box lets you specify the chart type (bar, area, pie, and so on).
-
The
Strokedbutton lets you toggle the drawing of the stroke by the chart renderers. - Two combo boxes let you specify the number of series and the number of data points in each series.
- A set of three toggle buttons lets you switch between a 2-D representation and a 3-D representation (with either an orthographic or an oblique projection).
- The bottom panel contains sliders that can be used to control some of the properties of the three-dimensional view of the chart.
-
Within the chart area, the following interactions are available:
- Moving the mouse over the graphical representation of a point highlights it.
-
You can change the rotation angle (horizontal move),or the elevation
angle (vertical move) by holding the
CTRLkey and dragging with the left mouse button. -
You can change the zoom factor (zoom-out for an upward move,
and zoom-in for a downward move) by holding the
SHIFTkey and dragging with the left mouse button.
How to Run the Sample as an Application
This sample can
be run as an application.
The installation directory contains
an executable JAR file,
chart3d.jar,
that allows you to execute the sample with a double click from a
file browser. Note that if you are using Internet Explorer, you can
open the installation directory
and execute the JAR file from the browser. This
technique may not work in other Web browsers.
Alternatively, you
can run the sample application from the command line.
First check that the Ant utility is properly configured. If not, see the
instructions on how to configure Ant for Perforce JViews.
Then, go to the installation directory
of the sample and type:
ant run
Topics Covered
- Switching between a 2-D and 3-D display.
- Changing the properties of 3-D rendering.
Detailed Description
This sample demonstrates the ability to easily switch between a 2-D and a
3-D display.
The chart configuration (renderer, interactor) is independent of the
representation mode.
The IlvChart.set3D method is used to switch between a 2-D and
a 3-D chart. The IlvChart3DView.setProjectionType method is
used to change the 3-D projection: it can be either orthographic or oblique.
The chart uses an IlvChart3DViewInteractor instance that
allows the user to interactively modify the view angles with the mouse.
It is also connected to an highlight interactor that changes the graphical
representation of the display item under the mouse (the code is similar to
the Highlight sample).
A dedicated panel is composed of sliders that are bound to some of the properties of the 3-D view (rotation, elevation, light properties, and so on). In the implementation of this control panel, we use the notifications sent by the view to synchronize the property value with the slider value.
Installation Directory
The Using 3-D Effects (SDK) sample is installed here.
Classes Involved
- ilog.views.chart.IlvChart
- ilog.views.chart.IlvChart3DView
- ilog.views.chart.interactor.IlvChart3DViewInteractor
- ilog.views.chart.interactor.IlvChartHighlightInteractor
- ilog.views.chart.interactor.IlvChartPickInteractor
- ilog.views.chart.graphic.IlvDataLabelAnnotation
- ilog.views.chart.graphic.IlvDataRenderingHint