Using templates
Explains how to create charts by using a template as a starting point.

Describes how to create charts, customize them and interact with these charts in different manners.
Creating charts from templates
Within the New Chart Wizard, you can use templates for creating your chart. A template is a predefined project which includes a style sheet designed for a specific type of application or style of presentation and an appropriate data model.
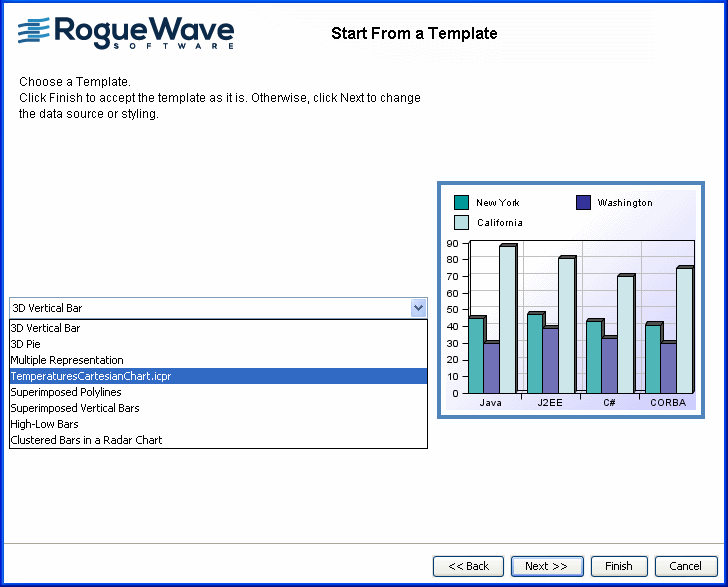
To start a new chart based on a supplied template:
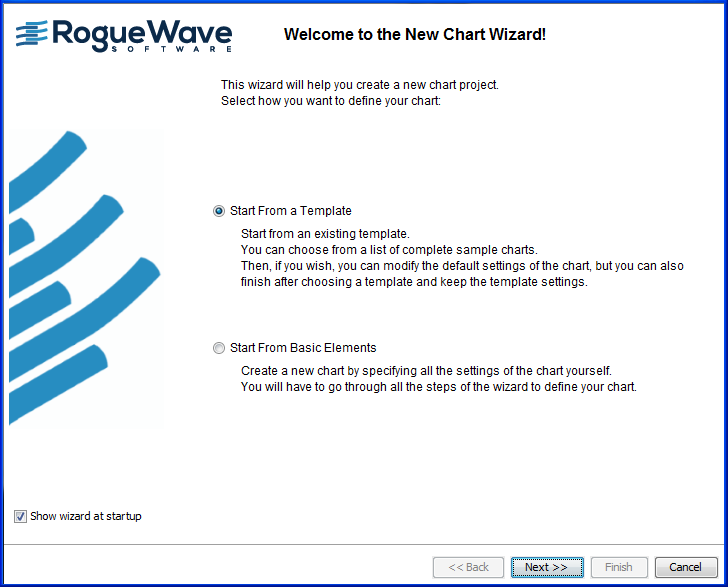
1. Click File > New from Wizard. The New Chart Wizard starts.
2. Select the option to start from a template and click Next.
The available templates are as follows:
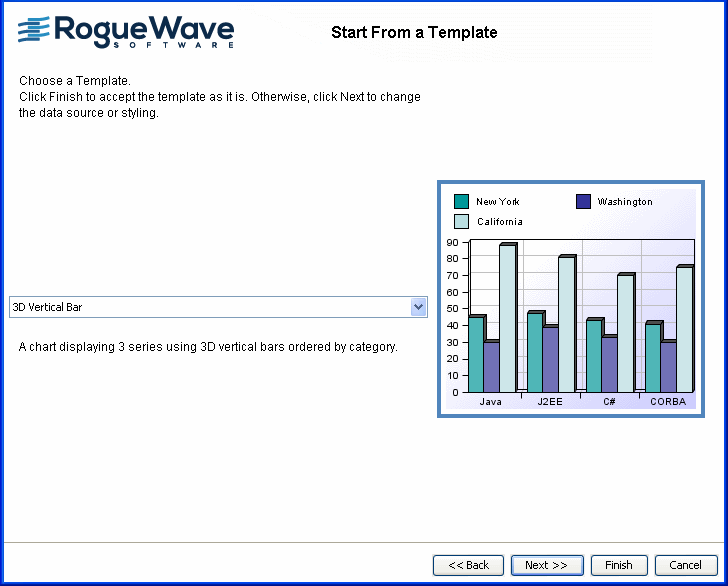
3D Vertical Bar
A chart displaying 3 series using 3D vertical bars ordered by category.
3D Pie
A 3D pie chart displaying one series composed of 5 values. The value of each point is displayed as a percentage over each slice.
Multiple Representation
A chart mixing different representation types: a Bar, a Polyline, a Area and a scatter renderers.
Superimposed Polylines
A Cartesian chart with polylines.
Superimposed Vertical Bars
A Cartesian chart with bars.
High-Low Bars
A High-Low-Open-Close chart.
Clustered Bars in a Radar Chart
A radar chart with bars.
3. From the list of templates, select 3D Vertical Bar.
From here, you can proceed in two different ways:
keep the predefined template as is,
or
customize the template by changing the data source and the styling.
To keep the predefined template:
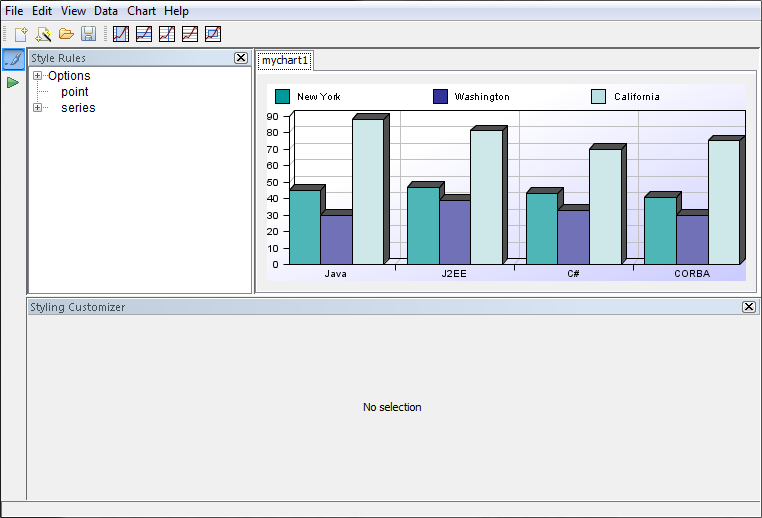
Click Finish to exit the Wizard if you are happy with the predefined template you have chosen from the list.
Your chart appears in the Designer with the style and data defined by the template you have selected. In this example you have selected the template “3D Vertical Bar”, your chart displays three series using 3D vertical bars ordered by category, as follows:
To customize the template by changing its data:
1. Select the template and click Next to continue.
The window Choose the Type of Data Source opens.
The Wizard automatically proposes you the data source appropriate for the template you want to customize. In this example, the Wizard proposes the User-Defined Data Model option. Click Next to continue.
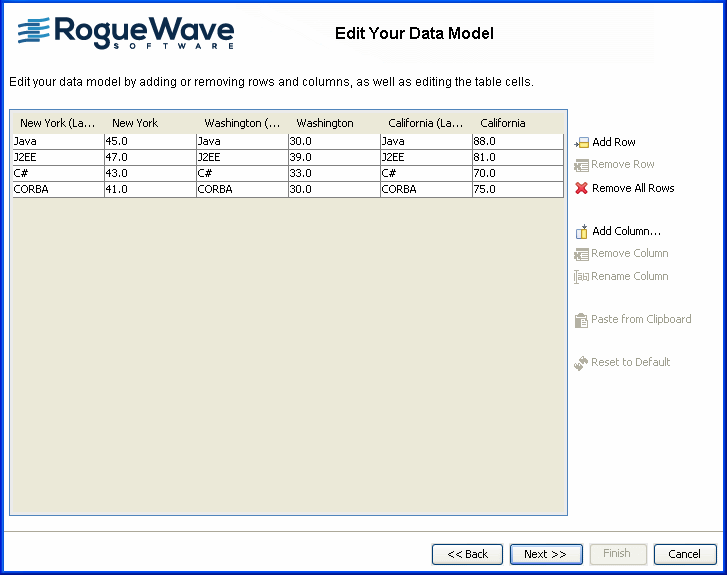
2. Edit the data model by adding or removing row and columns, clearing all the data or resetting the model to the default value.
3. Continue through the wizard, clicking Next to move between screens and Finish to complete the wizard.
To customize the template by changing its styling:
Redefine the type of chart and the graphical representation. For more details on how to do this, refer to
Creating a new basic chart.
If you want to create a family of charts with the same data and based on the same styles, you can create your own template.
To create a new template:
1. Create a chart that contains the required data, with all the styling you need.
You need the following files:
a
JViews Charts Project file (
.icpr )
a style sheet file (
.css )
a property file (
.properties )
It is important to have the three files in the same location.
From the menu bar, choose File>Save As and save the project file in the <installdir>/templates directory.
2. The style sheet.
The .css file is automatically created when you create your project. It has the same name ( TemperaturesCartesianChart.css) and is placed in the same directory.
3. Create a .properties file with the short and long descriptions of your template.
The template properties file must comply with a specific syntax so that a custom template is properly integrated into the wizard. The expected syntax for the .properties file is shown in the following extract:
ShortDescription = 3D Vertical Bar
LongDescription = A chart displaying 3 series using 3D vertical bars ordered by category
The properties file must contain the following keys:
. ShortDescription The text corresponding to this key is displayed in the list of templates.
. LongDescription The text corresponding to this key is displayed below the list of templates in a text area to provide a detailed description of the template.
Save the file with same name of your project, TemperaturesCartesianChart. properties and place it in the <installdir>/templates directory.
After you have saved this set of files, your template appears with the predefined templates in the New Chart Wizard.
Copyright © 2018, Rogue Wave Software, Inc. All Rights Reserved.