ここでは特定の人口範囲に従って、異なったグラフィック表示で都市を識別します。
3 つのスタイル・ルールを定義して、
population に関する 3 つの条件を指定する必要があります。-
ノード・ルールを選択して、「編集」 >「スタイル・ルールの作成」とクリックします。
-
「条件」ページで、条件「
population exists and not null」を指定します。 -
「終了」 をクリックします。
-
新しい
population exists and not nullルールを選択した状態で、「スタイリング・カスタマイザー」の「パラメーター」タブをクリックし、「イメージ」フィールドにパス file:./data/examples/lightBulb.gif を入力します。 -
Enter キーを押します。
-
-
population exists and not nullルールを選択した状態で、「編集」 >「スタイル・ルールの作成」とクリックします。-
「条件」ページで + をクリックして別の条件
populationis less than100000を定義します。 -
「終了」 をクリックします。
-
ルールを
population<100000に名前変更します。 -
新規
population<100000ルールを選択した状態で、「スタイリング・カスタマイザー」で「イメージ」フィールドにパスfile:./data/examples/Little.gifを入力します。 -
Enter キーを押します。
-
-
「
population exists and not null」ルールを選択して 3 つ目のスタイル・ルールを作成します。-
「編集」>「スタイル・ルールの作成」とクリックします。
-
+ をクリックし、条件
populationis greater than 1000000を定義します。 -
「終了」 をクリックします。
-
スタイル・ルールを
population>1000000に名前変更します。 -
新規
population>1000000ルールを選択した状態で、「イメージ」フィールドにパスfile:./data/examples/biga.gifを入力します。 -
Enter キーを押します。
-
結果は、次の図のようになります。
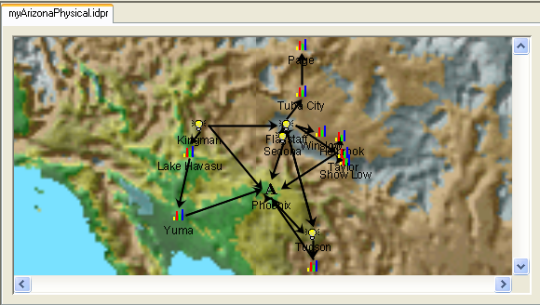
アリゾナ州の例におけるイメージの使用