To create the BAM dashboard shown in figure A dashboard definition, you
will need to create the following symbols:
- A progress bar symbol
- A stoplight symbol
- A region symbol
The progress bar will display the percentage of overall
capacity being delivered. This percentage is displayed by a bar which
changes width and color to show the percentage. The percentage is
changed by altering the value of a single integer parameter, progress.
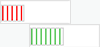
Progress bar states
The stoplight symbol indicates the overall state of key
performance indicators. It can display three possible states: good,
warning or problem. The state displayed represents the levels of key
performance indicators. It is changed by altering the value of a single
integer parameter, statusvalue.
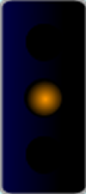
The warning state in the stoplight symbol
The region symbol uses the progress and stoplight symbols
to display key performance indicators and overall status for a business
region. It contains the following parameters:
- region - a string containing the name of the region
- shipments - the percentage of products shipped
- sales - the percentage of the sales target achieved
- production - the percentage production quota achieved
- status - the overall status of the region in regard to shipments, sales and production