Diagrams are used to show the relationships between entities
in a system. The entities are called nodes and
the relationships are called links.
This type of display helps model and manage a business system’s
entities connected either physically (like in a communications network)
or logically (like in a process flowchart) .
JViews Diagrammer can be used to build computerized
displays of static as well as dynamic diagrams. A diagram can be static
in the sense that there are no changes in its appearance while it
is displayed: it is a snapshot of a given system. Typical examples
include flowcharts and organization charts.
A dynamic diagram can react to user actions or external
data feeds, or both. It remains in contact with business data during
the display phase and is expected to change over time in response
to business-related changes. Typical examples include process flow
diagrams and network monitoring diagrams.
As diagrams grow larger and more complex, JViews Diagrammer
allows you to make them more readable through its built-in graph layout
algorithms, organizational techniques such as subgraphs and swimlanes,
helpful zooming and scrolling behavior, and even customized interactions
such as editing, drill-down, and more.
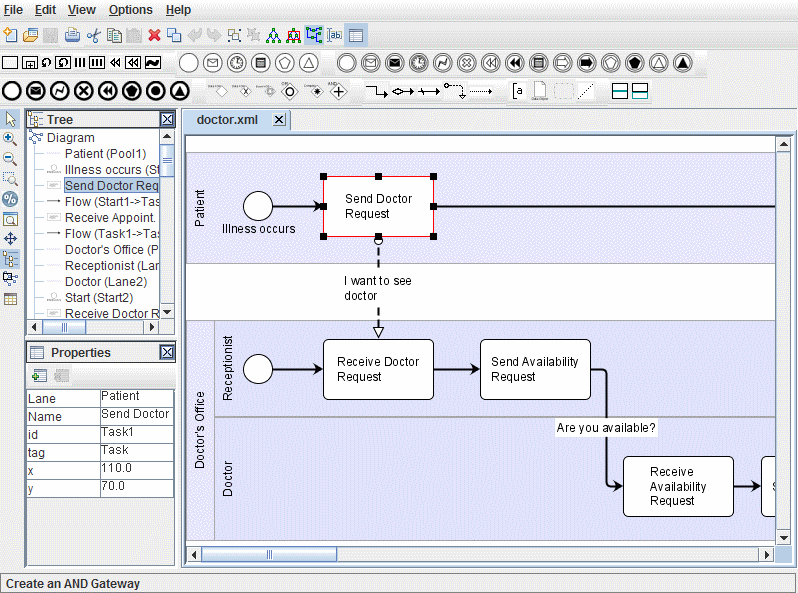
A workflow diagram
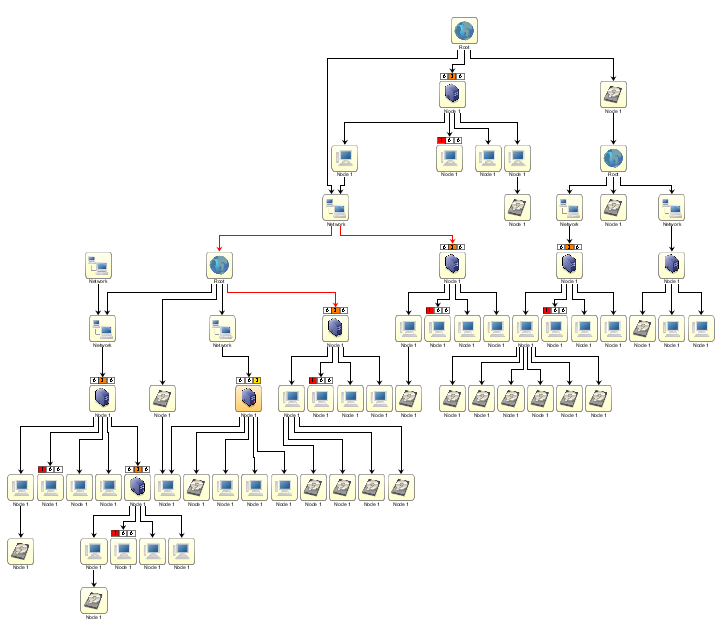
A topology diagram