Reading the Data
You import different data sources into a map to provide
different views of the data contained in the map. Each data source
is associated with a different map layer.
For example, you might start with a shape file, to provide
an uncomplicated view of the world as a backdrop.
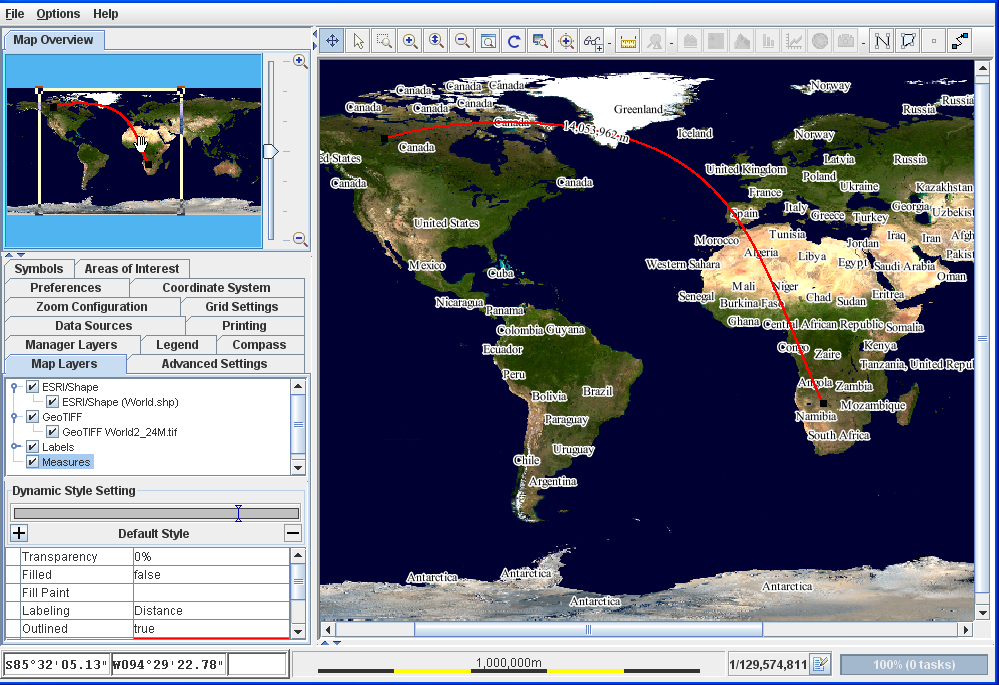
World map in an application
Then you could refine the esthetic representation of
the map by importing a GeoTIFF format map of the world.

World map in GeoTIFF format
You can add defense information about bases, topography,
and military corridors in a selected region by importing a map in CADRG format.
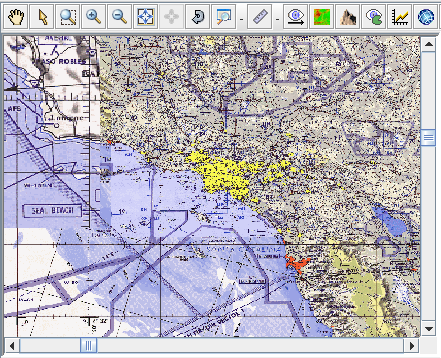
Data source in CADRG format representing areas in
California
Then you might add a pure VMAP (see VMAP format) vector defense map of a specific region,
such as North America, for example
vmaplv0\noamer. 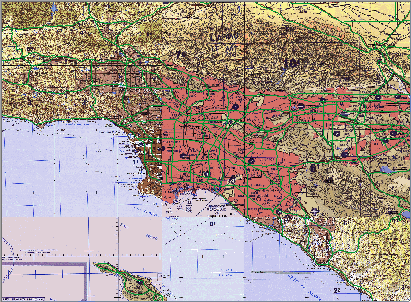
Vector defense map in VMAP format
Terrain Analysis detail, such as altitude information,
can be added from a data source in GTPO30 format.
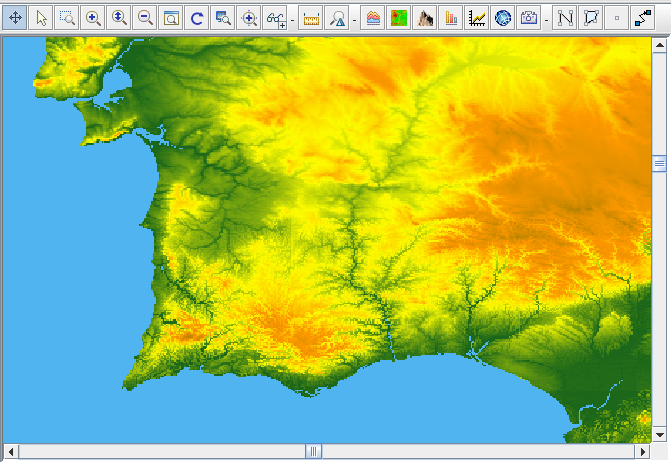
Elevation detail from data source for Terrain Analysis
Street level views can be added from GeoTIFF format and ESRI/Shapefile format data sources.
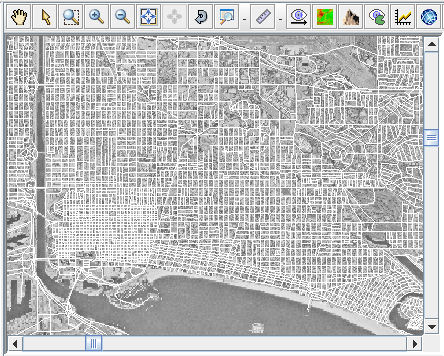
Street data in Los Angeles from an ESRI/Shape data
source
An example of the series of typical data source types
outlined here can be found in An example map in Using the Map Builder .
That particular example is based on North America and
Los Angeles in particular, but you could equally well import your
own data sources for say Iraq and al-Haditha or Basra, or Afghanistan
and Kandahar.
JViews Maps for Defense is supplied with the
Map Data disk, which includes general map formats that can be distributed
free.
Themes and styling
For each map layer you can decide its look and feel in
terms of its color, thickness transparency, and so on, and you can
define settings for specific zoom levels so that the look and feel
changes when users zoom in and out. The look and feel of each layer
and its zoom triggers represent a map theme. This is used to visualize
only meaningful information for each context.
Placing symbols
JViews Maps for Defense provides a library of APP-6a (NATO) symbols. This library allows you to
place standard APP6a:2525B symbols on a map. You can also add any
user-defined symbols to a map. Symbols are created using the Symbol
Editor and added to maps using the Designer for JViews Diagrammer.
You can then load the Designer project file that contains
the background map developed with the Map Builder and the Symbols added with the Designer, and load
it into your application. For more information about symbols, see
the JViews Diagrammer document Developing with design tools>Using the Symbol Editor.
Placing defense symbols
You can add symbol groups to contain symbols that represent
items of different types of warfare unit or equipment. The symbols
conform to the APP-6a Standard used by NATO.
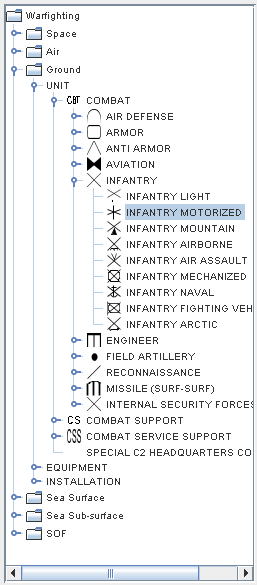
NATO Symbol Manager, Types of Symbol
Depending on the type of warfare selected and the type
of unit or equipment, you are offered a set of properties to describe
the object. JViews Maps for Defense places the APP-6a symbol corresponding to the property definition
in the position on the map specified in Latitude and Longitude coordinates
by the
Location property. 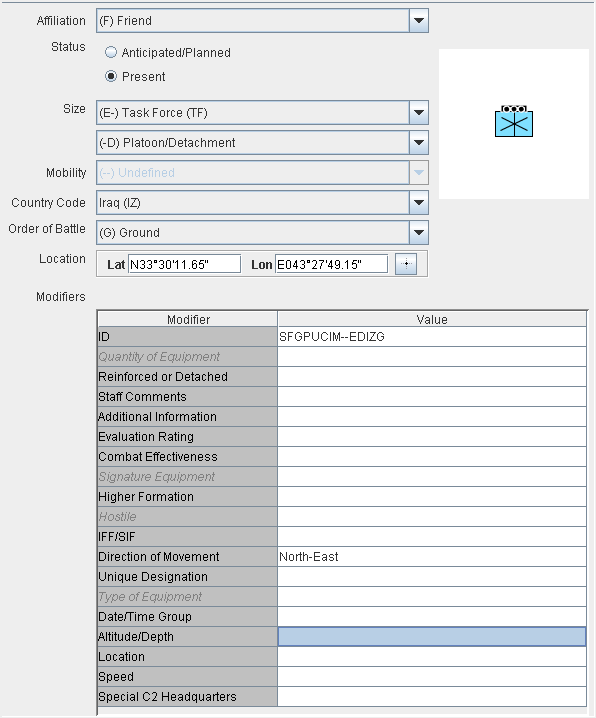
NATO Symbol Manager, Symbol Properties
Placing military resources
Equipment and troop placement are extremely important.
The Terrain Analysis features are designed to depict topographic data
accurately. With a few mouse clicks, you can create a Line of Sight
image to check whether troops and equipment are correctly positioned.
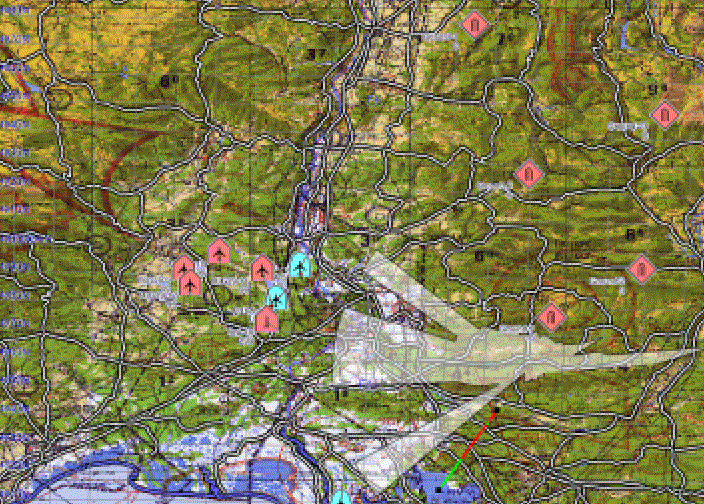
Mission preparation with APP-6a symbols and Line of
Sight
The Tools for the job
Rogue Wave® provides a sample
application, the Map Builder , that includes
the data reading and writing facilities and the layer styling facilities
for building theme in a point-and-click editor. The sample code
is accessible and you can easily customize it.
The product also includes the Designer for JViews Diagrammer. The Designer is a point-and-click
editor used for writing style rules that control the styling of nodes
on the map.
You can switch easily between these tools to hone your
application. Typically, you use the Map Builder
to speed up application development time by reading in the data sources
in different formats and then creating the map theme by styling the
layers. Then you would switch to the Designer to write style rules
to change the appearance of nodes depending on certain conditions
and to design symbols to represent nodes on the map.
For NATO symbols, you can choose from the standard military
symbol library, APP-6a in the Map Builder.
If you need more than these easy-to-use GUIs have to
offer, there is a full-featured SDK for refining and customizing your
application. In addition to the general mapping API of JViews Maps for Defense, you have access to
the Styling and Data Mapping (SDM) package of the JViews Diagrammer API for the styling of nodes to place
on a background map, and the whole of the JViews Framework API with its powerful graphics framework.
You have full control over what you do.
Mission execution
With today’s battlefield technology, you can use
prepared maps updated in real time with live streamed data. The prepared
maps can be streamed by satellite to a notebook in a military vehicle.
Up-to-date photographic data can be transmitted from Unmanned Aerial
Vehicles (UAV). You can have real-time data feed from PDAs
in the field. Data from the Global Positioning System (GPS) can also be streamed and displayed on the
notebook.
One could even imagine a situation where every soldier
has a life sensor for transmitting data to the notebook in the mobile
command center and the symbols on the map could reflect the position
of the troops moving in real time and their losses.
Key Strengths of JViews Maps for Defense
In the application, the up-to-date data can be displayed
against the background map with the appropriate symbols correctly
positioned.
The key strengths of JViews Maps for Defense make it ideal for asset-mapping
applications.
- Components, such as beans, readers, map displays, and map views, are easily customizable to adapt to your needs. Your existing system architecture can be maintained.
- Performance allows for almost instantaneous zooming in and out and the system can manage huge amounts of data.
- Animated symbols can show the movement of resources on the map.
In addition, with JViews Maps for Defense animated symbols can show the movement
of adversaries and the defense features provided with Terrain Analysis
make JViews Maps for Defense ideal
for use in battlefield scenarios.
- Terrain analysis gives you sophisticated features to make your battlefield intelligence more relevant:
- Cross-sections
- Line of Sight
- 3D View
- Fly Through
- Area of Sight
- Gradients
- Area detection
Since the map data and the map theme can be saved separately,
the map theme can be used to style maps for different regions so that
they have the same color scheme and visual properties. The final user
can then reuse this theme and apply it to the appropriate data source
at run time.
When the missions take place, the field officer can select
the basic map data or the latest satellite images and navtech data
and apply the theme with the appropriate GeoTIFF and Shape files.
Map applications built with JViews Maps for Defense can be an essential part of a decision
support center whether on or off the battlefield.