Zooming in on California
-
Click the
 button on the toolbar and draw a rectangle
around the California area to zoom in on it. If necessary, zoom in
again to enlarge the map more.
button on the toolbar and draw a rectangle
around the California area to zoom in on it. If necessary, zoom in
again to enlarge the map more.
Adding military data
-
Choose File>Add Map Data to open the file browser, select the CADRG format, and then select the drive where you downloaded and saved your data. For example, select the data source
A.TOCand then choose Open. -
Click the button on the toolbar and draw a rectangle
around the Los Angeles area to zoom in on it. If necessary, zoom in
again until the Los Angeles area fills the Map View. The following figure shows the resulting Map View pane.
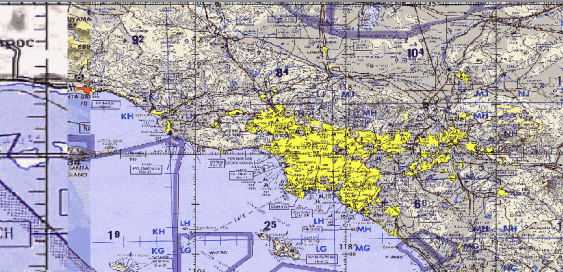 The data source CADRG A.TOC
Adding vectorial VMAP data
-
Choose File>Add Map Data to open the file browser, select the VMAP format, and then select the drive where you downloaded and saved your data.
-
For example, select the data source
noamer -
Select Transportation (Roads) in the Features Choice pane, click the
 button, and draw a rectangle around the
part of the map where you want to add vectorial VMAP Data (Los Angeles).
While you do this the Select Data Sources window remains open.
button, and draw a rectangle around the
part of the map where you want to add vectorial VMAP Data (Los Angeles).
While you do this the Select Data Sources window remains open. -
Choose Open.The following figure shows the resulting Map View pane.
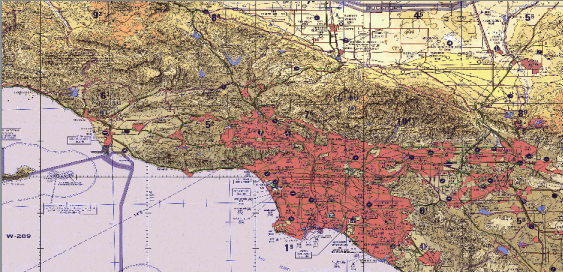 The data source VMAP noamer
 -
In the Map Layers pane, open the VMAP hierarchy and select
Road(secondary Route)to display the corresponding map style property sheet. -
Select the
Line Widthproperty in the map style property sheet and set theLine Widthvalue to 3.0. -
Click in the right column of the
Line Colorproperty in the map style property sheet, click the button, and set the
 Line Colorvalue to black using the Color Editor displayed.The following figure shows the resulting Map View pane. The data source VMAP noamer Road (secondary route)
Adding altitude information
-
Choose File>Add Map Data to open the file browser, select the GTOPO30-DEM format, and then select the drive where you downloaded and saved your data. For example, select the data source
W140N40.DEM, and then choose Open.The following figure shows the resulting Map View pane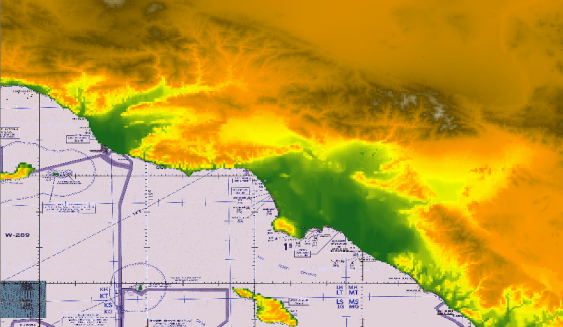 The data source GTOPO30-DEM W140N40-DEM
 -
Select the GTOPO30-DEM layer in the Map Layers pane and drag and drop it just below the ESRI/Shape layer.
-
Select the Preferences tab and set the
Distancesproperty to International Statute Mile, theAltitudesproperty to International Foot, and theCoordinatesproperty to UTM. -
Select the Map Layers tab to redisplay the pane and then click the
 button to display the whole map in the
Map View pane. The following figure shows the resulting Map View pane.
button to display the whole map in the
Map View pane. The following figure shows the resulting Map View pane.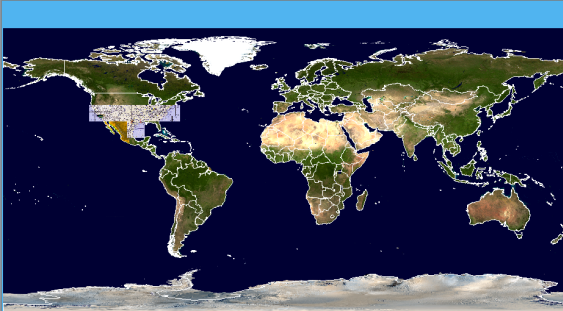 The data source GTOPO30-DEM W140N40-DEM
 -
Select the VMAP layer in the Map Layers pane, click the
 button to zoom to the content of this
layer, and then zoom in on Los Angeles.
button to zoom to the content of this
layer, and then zoom in on Los Angeles. -
Select the
Visible in Overviewproperty in the map style property sheet and set the value tofalseto prevent this layer being displayed in the Overview pane. -
Click the button again to display the whole map
in the Map View pane.