Rogue Wave® JViews introduces a new
interaction technology named Hitmap that considerably improves the
responsiveness and the interactivity of JViews web applications.
Hitmap technology enables you to provide pure client-side
interaction capabilities in JViews web applications without
requiring round-trips to the servers.
Highlighting and tooltips are typical
interactions that you can perform using Hitmap technology. This
section provides an overview of Hitmap technology.
For detailed instructions on how to perform highlighting and
tooltips using Hitmap technology, see Highlight interactor and Tooltip interactor.
Background
The web was originally designed as a
text-oriented distributed hypertext environment. Providing rich
interactive graphics on this platform is much in demand. However,
this demand has not yet been met with a satisfying, simple, and
unified solution.
Three approaches compete to provide rich
interactive graphics on the web:
- Proprietary plug-ins and extensions to the web protocols, such as Flash® , Java™ applets, and Silverlight™ .
- Newer standards for web graphics, such as the Canvas HTML tag.
- Thin-client technologies, where the web server generates the graphics and sends them as images. This is the approach on which JViews web technologies are based.
The main drawback of the thin-client
approach is the limited interactivity it provides. Each time the
user clicks or performs a graphical interaction, a round trip to
the web server has to be made to provide an updated
representation of the display. JViews introduces the Hitmap
technology to improve this situation.
In the context of graphical thin-client
web applications, Hitmap technology performs fast hit testing on
arbitrary graphic objects, thereby enabling the application to
associate application-related information to a point or an area
designated on the screen.
For example, the following thin-client web
application screen displays a user-editable workflow network:
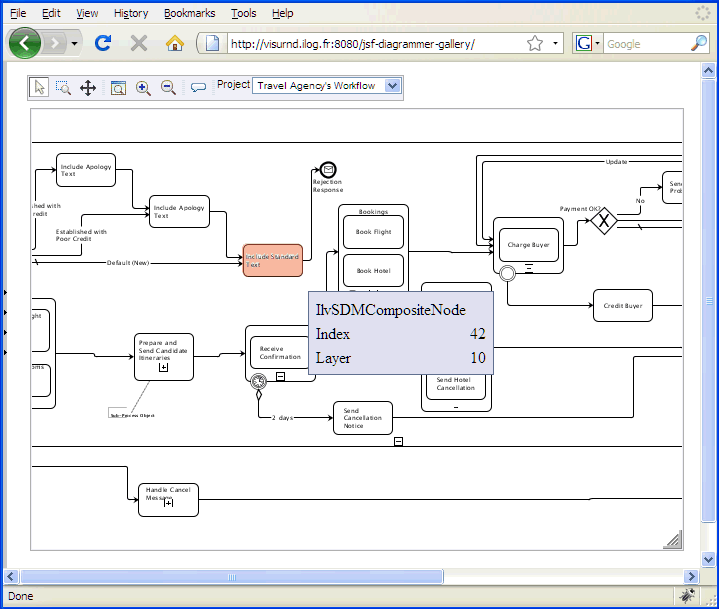
The image in the center is a bitmap generated by the server and
displaying some network data. Without the Hitmap technology,
clicking or hovering over a node to highlight this node and
display related information requires sending to the server the
coordinate of the point clicked, having the server compute the
object that corresponds to this point, and returning a newly
computed image representing the highlighted object (in orange),
as well as the application data associated to this object (here,
the phrase
IlvSDMCompositeNode
). This greatly reduces the interactivity and the responsiveness
of the thin-client solution.
What would be preferable instead is a
means to retrieve, inside the client web browser, the semantic
data associated to the object and the boundaries of the object to
highlight, and then to execute local scripts to perform the
highlighting and tooltip display, or any appropriate feedback,
locally.
The natural (trivial) approach to
implementing such graphics-to-application domain mapping in
graphical applications is to maintain a data structure of graphic
objects (polygons, text areas, rectangles, icons, and so on) and
to associate to each of those objects a pointer to application
domain objects. Hence, when the mouse is pointed at a region of
the application display, traversing this data structure allows
the application to retrieve the intersecting objects and from
them to retrieve the semantic data associated with them. While
this approach is easy to implement and is used in regular
graphical user interfaces, it suffers some drawbacks in
thin-client applications, which Hitmap technology resolves.
With Hitmap technology, the application
defines a buffered and raster data structure that allows the
application to reduce the computation cost when doing hit tests.
The “color indices” in the associated bitmap do not represent
real colors to display, but instead indices in an array of
application data objects sent separately. Hence, this raster map
embeds both the geometry of the graphic representations and the
mapping to the related application objects. Because there are a
limited number of objects that are useful to represent on the
screen, the total number of “colors” used is very low and these
images are highly compressible and very fast to generate. Thus,
you can minimize the client-server bandwidth and extra
server-side computation, while providing precise geometric
description and application object mappings.
With Hitmap technology, the hit test and
also the highlighting can be performed offline and do not cost a
round-trip to the server. This gives JViews web applications
excellent responsiveness and has a number of useful applications.
Data structure of the Hitmap
The Hitmap uses a raster data structure.
Compared to the bitmap data structure that gives the color
information of each pixel, the Hitmap data structure gives the
hit test information of each pixel.
The set of pixels that have the same “color
index” in the hitmap is called a region. A region consists of those pixels
of a graphic object that are not hidden by other graphic objects.
For example, the following image shows two
regions, coming from two graphic objects: a red line and a blue
square.
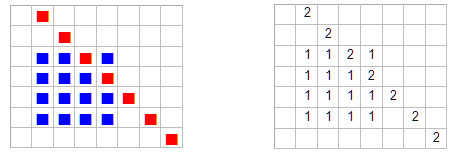
The structure in the image on the left
shows how the color information is represented. The structure in
the image on the right shows the hit test information of the same
bitmap, where the number 1 means that the pixel belongs to the
first region (the blue square pixels that are not hidden by the
red line) and the number 2 means that the pixel belongs to the
second region (the red line).
You can consider a Hitmap as an indexed
bitmap. Given the x and y coordinates of the mouse position, you
can immediately tell to which graphic object the pixel belongs.
This is why the hit test can be done extremely fast. Given the
index of a region, you can easily find all pixels that belong to
that region. This provides a fast way to highlight graphic
objects.
How to generate the Hitmap
The Hitmap can be generated using the Java
2D™ drawing pipeline with a customized raster composite.
Compared to a normal raster composite that writes pixel color
information to the buffer when rasterizing graphic objects, the
Hitmap composite writes the index of the graphic object being
rendered to the raster buffer. Other 2D drawing pipelines can
also be used to render Hitmaps.
For example, when rendering the red line
shown in the preceding image, a normal raster composite marks the
corresponding pixels as red. However, the Hitmap composite
assigns the index of the red line, in this example 2, to the
corresponding pixels.
The Hitmap generation is similar to normal
painting but costs less in CPU time. Tests show that generating
and compressing a Hitmap requires only 20% of the time consumed
by the normal rendering and compressing of the same image.
How to associate application data to Hitmaps
When the server generates the Hitmap, it uses a corresponding
table of application data objects. This table is kept and
transmitted to the client software in addition to the bitmap and
the Hitmap. JavaScript methods are provided (embedded in the
client's HTML page) to retrieve the “pixel
color” of a given point in response to a user mouse event, and
from this “color” information, turn it
into an integer (the region index) that is used to retrieve the
application data associated with the area of the display on which
the user clicked.
The following are examples of Hitmap use
cases and applications:
- Tooltips: the client software uses the Hitmap and the associated application data to locally construct and display tooltips. See Tooltip interactor.
- Highlighting: the client software superimposes a semi-transparent bitmap on top of the original image sent by the server to create a highlight effect and provides feedback that the user has, for example, selected a node in a graph display. See Highlight interactor.
- Keyboard navigation: The client software retrieves for each region some information containing references to four graphic objects. This information determines which graphic object the focus will be moved on to when the user presses a particular arrow key.
- Cursor: The client software changes the cursor shape according to information that has been specified for each region.