Ultimately, diagrams are displayed on the user screen within views
that can occupy an entire window or part of one.
Each view has its own zoom level and
displays a part of the diagram. The user can zoom and pan within a
view to focus on regions of interest. At any moment, multiple views
can be used with a single diagram as if the user had several
cameras to give different points of view, see the following figure.
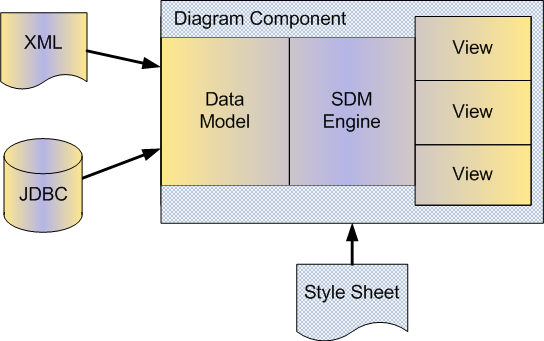
A diagram component with multiple views
The overview is a special use of the
multiple-view concept: it is a view that displays the entire
diagram in miniature, overlaid with a navigation rectangle that
represents the visible part of the diagram in the main view. By
moving and resizing this rectangle, the user can easily zoom and
pan the main view.
The diagram’s graphical objects can be grouped in layers
that control their display priority. You may, for example, decide
that the nodes and links are in a higher layer than the background
map: they are always displayed on top of the map. You may also
decide that labels are always displayed on top of everything by
grouping them in the highest layer. Layers can also be set visible
or invisible—for each view—so that you can temporarily hide an
entire group of symbols or a background map.
Finally, JViews Diagrammer offers three alternative views of a
diagram’s data model: a table view, a tree view, and a
property sheet.
In the table view, the properties of the
nodes and links are displayed as a Swing JTable that can be edited
in an application. In the tree view, the data model is displayed as
a Swing JTree, which is useful for selecting objects—the Data Model
panel in the Designer uses this view. For both of these, see the
following figure.
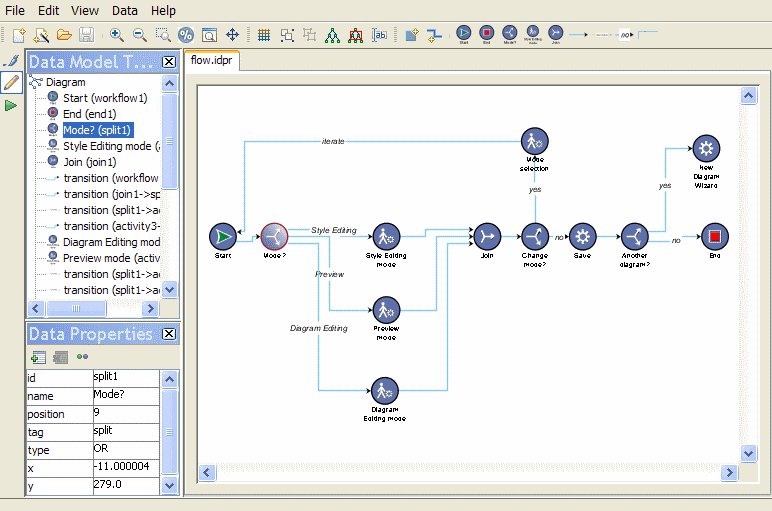
Tree view (upper left) and table view
(lower left) in the Designer
In a property sheet, a simple list of
properties is displayed—the optional Styling Properties panel in
the Designer displays this view.