If the data source is a SVG file, there are
additional options that you can set.
The following figure shows the options
available when importing an SVG file.
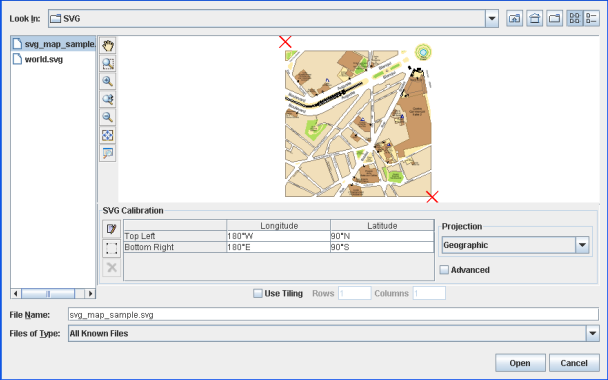
Select Data Sources pane for an SVG
file
-
Choose File>Add Map Data to display the Select Data Sources pane.
-
In the top part of the pane click the gray rectangle to preview the image and use the toolbar to pan, zoom in/out, and fit the image to the view.
-
By default the SVG Calibration pane is displayed in "bounds mode". In bounds mode you can set the latitude and longitude of the image manually. Click the row and enter the coordinates. You can also click the
 button to
interactively select the boundaries.
button to
interactively select the boundaries.
-
To switch to "control point" mode, click the
 button. This adds
two columns: Pixel Column and Pixel Line. In this mode you can
set the position of the image manually using the
button. This adds
two columns: Pixel Column and Pixel Line. In this mode you can
set the position of the image manually using the
pixelproperties or thelatitude\longitudeproperties. In addition, you can drag the red crosses to the point you want; this automatically sets the property values in the SVG Calibration pane. The red cross associated with a selected row is contained in a rectangle. -
Click the
 button to add
another row and another red cross in the Image pane.
button to add
another row and another red cross in the Image pane.
-
Click the button again to
return to bounds mode.
-
To remove a row from the Image Calibration pane, select the row and click the
 button.
-
Select Use Tiling, if you want to use this option, and set the number of rows and columns.
-
Click Open.