If the data source file is a Web Map Server (WMS)
image, there are a number of other parameters that you can set.
The following figure shows the options
available when importing a WMS image.
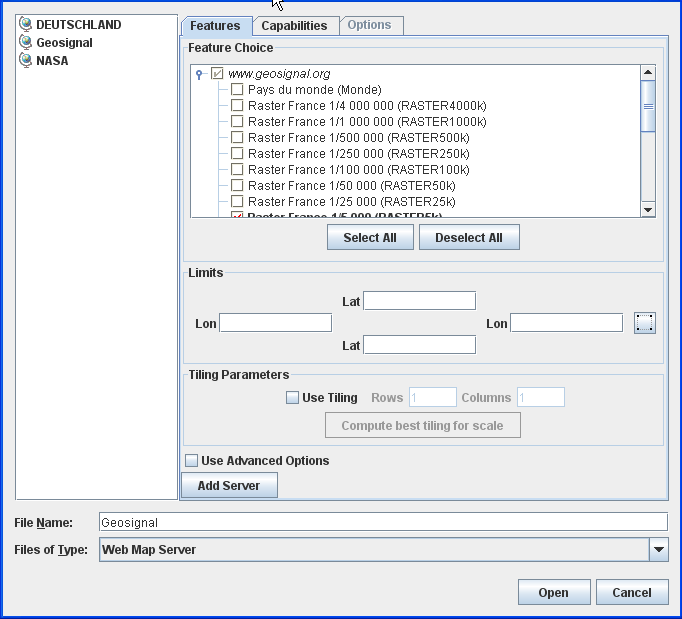
Select Data Sources pane for a WMS
image
In the previous figure the red cross on
certain servers indicates that these servers were not available at
the time the Map Builder was started.
-
Choose File>Add Map Data and select Web Map Server as the file type, to display the Select Data Sources pane for WMS images.
-
If you need to specify a server that does not appear on the list, click the Add Server button. Enter a name for this server, and the get capabilities URL associated with this server (this information is usually provided by the WMS server).For instance,
http://wms.jpl.nasa.gov/wms.cgi?request=GetCapabilities
orhttp://wms.jpl.nasa.gov/wms.cgi
Click OK to return to server list, where you can select the newly added server. -
Select a map in the left pane to display the corresponding features in the Features tab, and then select the features you want to display in the Feature Choice pane.
-
Use the Select All button to select all the features or the Deselect All button if you want to remake your selection.
-
Click the Capabilities tab to display the Capabilities pane. The Capabilities pane shows the response from the server to the capabilities request. This pane is for information only and displays the layers that are available in the WMS data.The following figure shows the Capabilities pane.
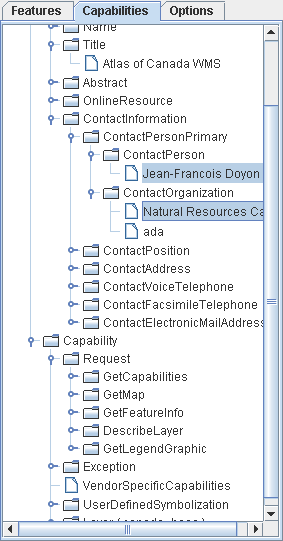 Capabilities pane
 -
Select Use Advanced Options, to activate the Options tab and then click the tab to display the Request Options pane. The Request Options pane contains a number of options that you can set.The following figure shows the Options tab.
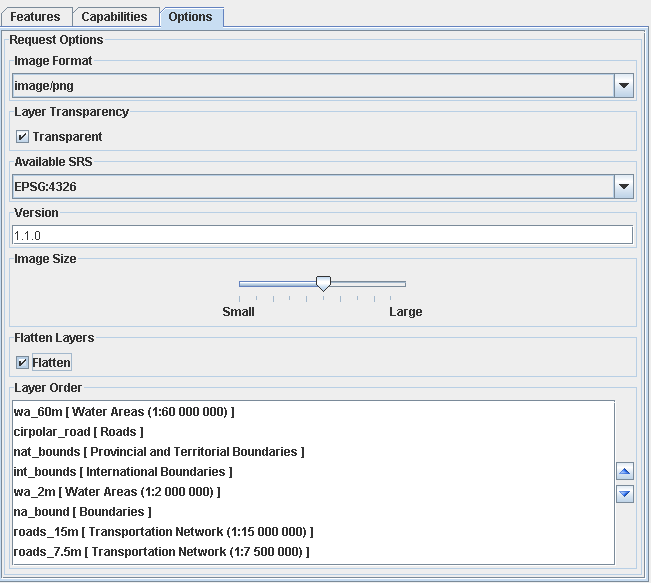 Options pane
 -
In the Limits pane, set the limits manually for the Lat/Lon properties or click the
 button and then
draw a rectangle in the Map View to set the limits.
button and then
draw a rectangle in the Map View to set the limits.
-
To use load-on-demand, select the Use Tiling check box and specify the number and lines and columns of tiles you want to divide the limits region (specified above) into. Given that WMS servers usually limit the image size of a request, this helps improve the overall region resolution by using the specified request image size per tile (one image request per tile load instead of a unique image request for the whole area of interest).
-
If you know the scale you want to display the image at, click Compute best tiling for scale. An Enter Scale input window then opens in which you can enter the desired scale with which the tiling parameters will be computed. According to the image size specified in the advanced Options tab, the Map Builder will compute the tile and column counts so that the overall image will have the desired resolution. The scale should be entered either in decimal format or with the 1/xxx notation.You can click the Get the view scale button to choose the current view scale.
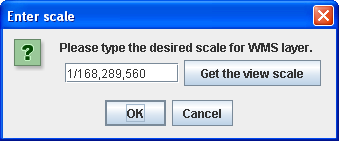 Enter scale pop-up window
 -
Set the image format by selecting from the list displayed in the Image Format pane.
-
If you want the layers to be transparent, check the Transparent box in the Layer Transparency pane.NoteTransparency is only supported for
.gifand.pngimages. Specifying transparency for other image formats may lead to strange results. -
Select the Available SRS from the list displayed in the Available SRS pane. The Available SRSs are the available Spatial Reference Systems in which a layer can be displayed. You can only display a layer using one of the SRSs in this list. The list is retrieved from the capabilities request.
-
Set the version number you want in the Version pane. This property allows you to specify the version number as an attribute in the request to the server. Some servers only respond to requests with specific version numbers and reject the request if the version does not match the number they are expecting.
-
In the Image Size pane, set the size of the image by dragging the slider to the required position. This is the size of the image requested on the server and not the size of the image displayed in the Map View. Once read, the image is displayed in the Map View. However, the size of the displayed image does not depend on the size of the requested image since it is georeferenced, but specifying an image size in the request can be useful for tuning the precision versus load time ratio.
-
Check the Flatten box in the Flatten Layers pane to display only one layer for all the selected features. If this option is not checked and you select more than one feature in the Feature pane, a map layer is created for each feature selected.
-
To change the layer order, select a layer in the Layer Order pane and click the
 or
or  button to move the
layer up or down one position. Note that to carry out this
operation, you must have the Flatten
option checked, because the layer order specifies how the
features selected in the Features Choice pane are stacked in
this single map layer.
button to move the
layer up or down one position. Note that to carry out this
operation, you must have the Flatten
option checked, because the layer order specifies how the
features selected in the Features Choice pane are stacked in
this single map layer.
-
Click Open.