A map displays one or more data sources,
which describe the map components. A data source provides the map
components, such as polygons and lines, and their properties. If
you import more than one data source, each is placed into a
separate layer that forms part of the map background.
Layers are also used to contain other information, such as
grids, labels and measurements. You can control how much
information is displayed at any one time by selecting which
layers to make visible. See Map
themes and zoom levels for more information.
Most layers allow users to define styling parameters, such as color, border
thickness, or labels for the
graphical components. You can adjust the order of layers and the
transparency of its content so that one layer does not obscure the
information in another (see Managing map layers).
A component is the lowest level of object and can be considered as
a polyline with properties such as
name
and
position
(used for streets for example), or as an area with properties such
as
name
and
color
(used for countries for example). Component properties can be used
for labeling or filtering and are displayed in the tooltips (if
activated on the map), and in the Property pane of the selected
layer.
The purpose of layers is to provide a
hierarchical organization/decomposition of the map represented
using a given style. There is no limit to the number of layers you
can define. The contribution that each layer makes to the overall
theme is known as a layer style.
For example, a map background layer could
consist of ground transportation with roads, motorways, streets,
and tunnels defined as sublayers. Or the map background layer
could be based on legal boundaries with countries, states,
counties, cities, and blocks defined as sublayers.
The following figure shows an example of a
map showing road, highway, and motorway layers.
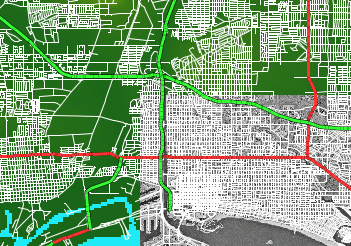
A map displaying layers
Layers are displayed in a pane in the Map Builder under the Map Layers tab.
For more information, see Managing map layers.