Configuring the Projector
Describes the projector and how it can be used with points and rectangular areas.

Describes the different types of projector and their properties.

Explains how to project a data point.

Describes how to project rectangular areas.

Explains how to project a set of data points.
Projector Properties
The conversion between data space and display space is performed by a projector owned by the chart. Depending on its type, a chart uses one of the two predefined projectors available in the JViews Charts package:

Cartesian projector

Polar projector
The projector used by a chart can be retrieved with the
getProjector method.
Projector properties are accessible through the API of the
IlvChart class.
The
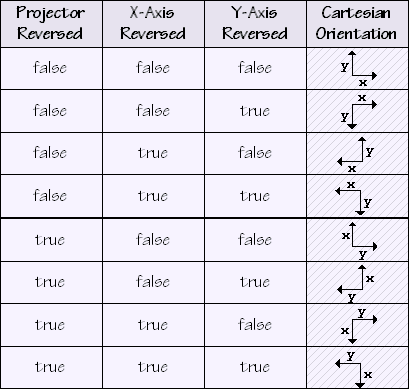
setProjectorReversed method allows you to reverse a projector. A reversed projector swaps the meaning of the abscissa and ordinate coordinates of a point. For example, a reversed Cartesian projector projects
x-data values along the
y-axis of the screen.
Cartesian Orientation illustrates the different Cartesian orientations that can be specified by using this property in conjunction with the reversed property of an axis:
Cartesian Orientation
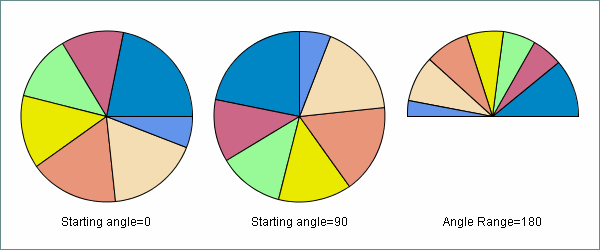
The IlvChart class also provides methods to change the specific properties of a polar projector:
Polar Properties shows how these properties modify the appearance of a pie chart:
Polar Properties
Projecting points
The
IlvChartProjector interface defines two methods to perform the conversion between data points and display points:
 toDisplay
 achieves the
forward projection (from data space to display space).
 toData
 achieves the
inverse projection (from display space to data space).
Both methods use the following parameters:

An
IlvDoublePoints object that holds the points to project. The contents of the
IlvDoublePoints is directly modified by the method.

A
Rectangle object that represents the display coordinate system.
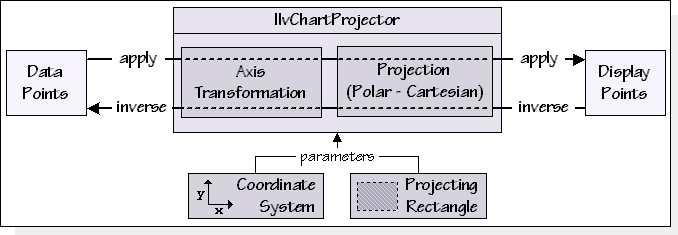
The projection pipeline is illustrated in
Chart Projector:
Chart Projector
The projection is performed in two stages:

Apply the transformations that are set on the axis of the provided coordinate system.

Transform the data values into display coordinates according to the provided projecting rectangle, and the visible range of the axis.
The following code extract shows how to project a data point:
IlvChart chart = ...;
// x and y are the x- and y-values of the data point.
IlvDoublePoints pts = new IlvDoublePoints(x, y);
// The following lines are equivalent to: chart.toDisplay(pts).
IlvCoordinateSystem coordSys = chart.getCoordinateSystem(0);
Rectangle projRect = chart.getProjectorRect();
chart.getProjector().toDisplay(pts, projRect, coordSys);
System.out.println("Projected coords: " + pts);
NOTE The projecting rectangle returned by the
getProjectorRect method is expressed in the coordinate system of the chart area component. The projected coordinates are always relative to the upper-left corner of this component. For more information on the components of a chart, please refer to
Creating a Chart.
Projecting rectangular areas
Rectangular areas are represented by:
 java.awt.Rectangle
 objects in display space.
The
IlvChartProjector interface defines the following method to convert rectangular areas:
 toRectangle
 converts a data window to a display rectangle.
The following code extract shows how you can use the toDataWindow method to retrieve all the points of a data set that are projected within a given rectangle:
Rectangle selectRect = ...; // The selection rectangle
IlvDataSet dataSet = ...;
IlvCoordinateSystem coordSys = chart.getCoordinateSystem(0);
Rectangle projRect = chart.getProjectorRect();
IlvChartProjector prj = chart.getProjector();
// Convert the selection rectangle into a data window.
IlvDataWindow w = prj.toDataWindow(selectRect, projRect, coordSys);
// Fetch data points that lies within the computed window.
IlvDataPoints pts = dataSet.getDataInside(w, 0, false);
Projecting a set of data points
Several methods in the IlvChartProjector interface let you project a set of data points into java.awt.Shape objects:
 getShape
. The considered set of data points is formed by all the points contained in the specified window.
 getShape
. The considered set of data points is formed by all the points that have a fixed
x- or
y-coordinate, and that lie within the visible window.
 getShape
. The considered set of data points is formed by all the points that have a fixed
x-coordinate, and a
y-coordinate that lies within a specified interval, or vice versa.
Copyright © 2018, Rogue Wave Software, Inc. All Rights Reserved.


