Creating a diagram
Explains how to create a diagram through the New Diagram Wizard.

Explains how to launch the wizard that helps you create a diagram.
Lists the different choices of data formats and how to select the one to use in this tutorial.
Explains how to import XML data from which to create a diagram.
Explains how to edit the XML file data model.
Presents the choices of diagram and how to select the appropriate one for your diagram.
Proposes a list of graph layout choices and explains how to select the one for this tutorial.
Launching the New Diagram Wizard
To start a new diagram if the wizard is not open:
1. Click File > New From Wizard.
1. 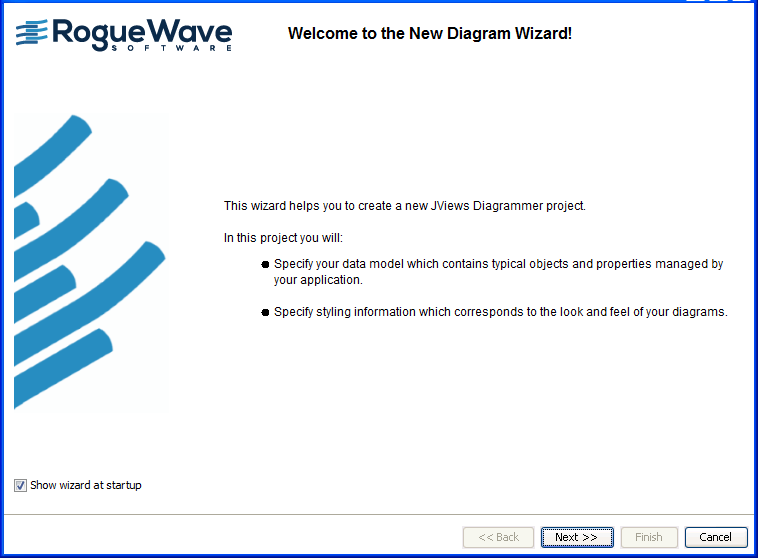
New Diagram Wizard
2. Click Next to choose the type of data source.
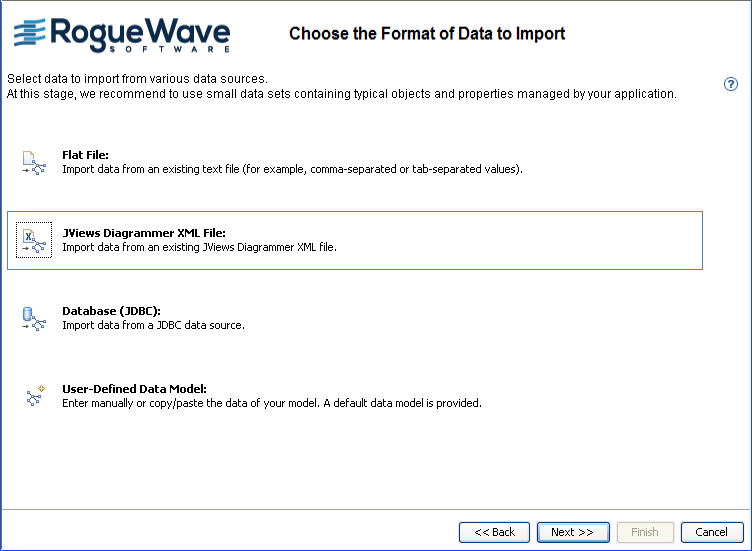
Choosing the format of data to import
The New Diagram Wizard gives you a choice of the following formats of data to import:
Flat file, for example, Microsoft® Excel® file in CSV (comma-separated values) format
XML file in diagram format
Database supported by JDBC™ (Java Database Connectivity), for example, Microsoft® Access®
User-defined model, to start from a default data model with a few data items
The example built up in this section uses data in an XML file.
For an example of a database, see
Importing data from a database. For an example of a flat file, see
Importing data from a flat file. For an example of the user-defined option, see
Creating a user-defined data model.
Click
JViews Diagrammer XML File and
Next.
Choosing the XML File option
Importing your JViews Diagrammer XML data
An XML document is supplied as file
genealogy.xml in the directory
<installdir>/jviews-diagrammer/bin/designer/data/examples of
JViews Diagrammer. This document contains a
data model for a genealogy example.
To load data from the file genealogy.xml:
1. Click Import.
2. Browse to the directory <installdir>/jviews-diagrammer/bin/designer/data/examples.
3. Select the XML file genealogy.xml and click Open.
4. 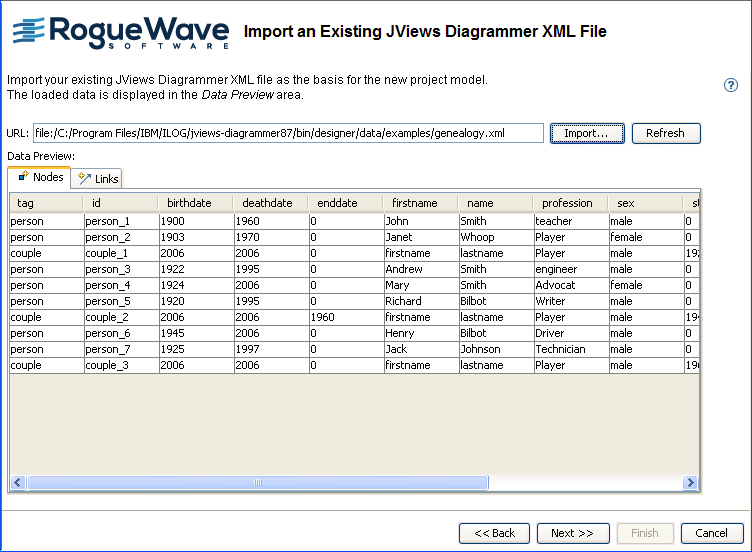
Choosing to load data from an XML file
You see your data in table format: a table for the nodes and a table for the links.
Note that the XML data includes x and y values in the genealogy example.
5. Click Next to move to the Edit Your Data Model page.
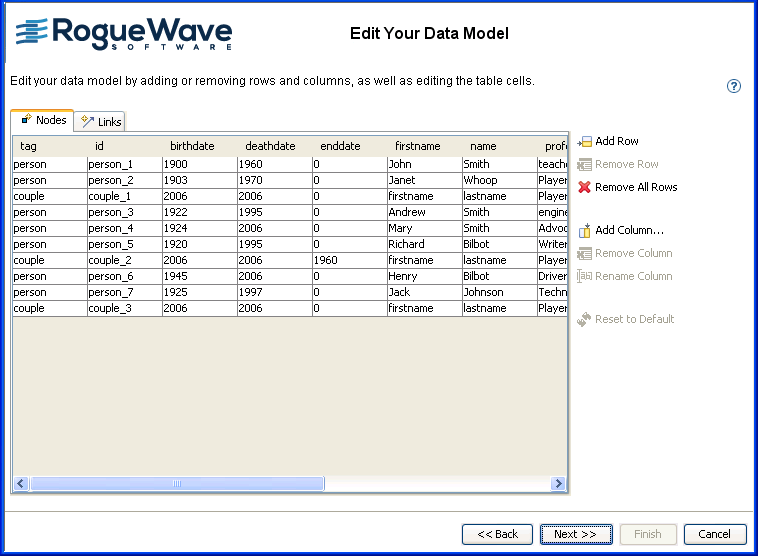
Editing the data model
You can edit the basic data model in the following ways:
Add and remove rows (a row represents an object in the data model)
Add, remove, and rename columns (a column represents a property of the objects in the data model)
Change cell values (a cell represents a property of a specific object)
Remove all objects
Restore the data model to its initial state
To clear all the data values, click Remove All Rows. To retrieve the values you saw initially, click Reset to Default.
Properties id and tag are mandatory for the SDM model and therefore cannot be removed or renamed by the user.
Editing the XML file data model
You will keep this data model as it is.
To validate your data model:
Click
Next.
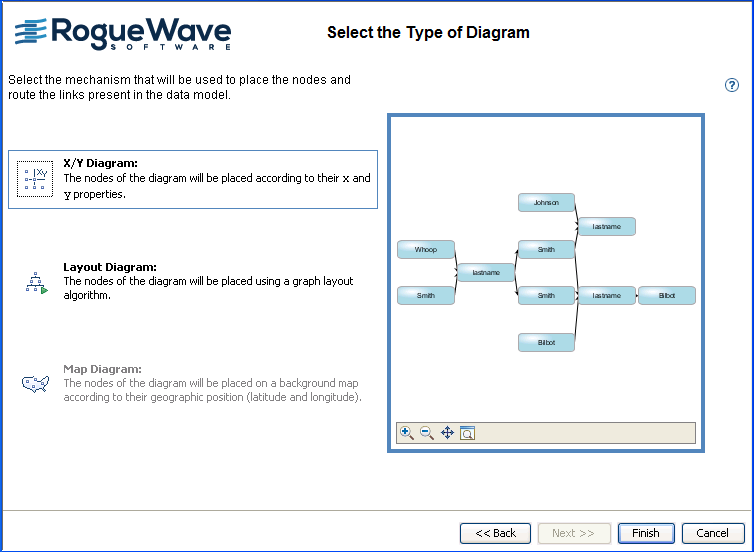
Selecting the type of diagram
When you load data from an XML file, a default style is automatically applied to the
nodes and
links. You can see a preview in the small pane on the right of the wizard.
You can select from three types of diagram:
X/Y Diagram: Nodes are positioned according to x- and y-coordinates. The x and y attributes must be present in the data.
Layout Diagram: Nodes are positioned according to a graph layout algorithm. The default graph layout algorithm is Hierarchical.
Map Diagram: Nodes are positioned according to their latitude and longitude values on a map. The latitude and longitude attributes must be present in the data.
NOTE You can build a Map Diagram only if you have purchased and installed the Rogue Wave® JViews Maps product. The Designer warns you if JViews Maps is not available when it is needed.
The XML file contains x and y values, so the X/Y Diagram is selected by default, see the following figure.
Specifying a diagram type
If positioned according to their x and y coordinates, the nodes overlap. A graph layout gives better results.
To select a different type of diagram:
1. Click the icon for Layout Diagram.
2. Click Next.
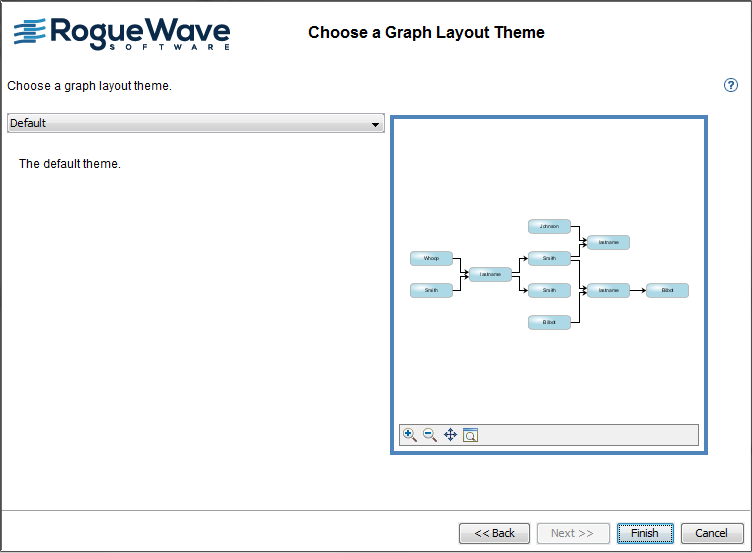
Choosing a graph layout theme
A graph layout theme applies styling to a graph layout to configure the way nodes and links are interconnected and arranged. A layout theme consists of a partial style sheet. It is a convenient way of applying a precustomized layout that you want to reuse in different projects.
Choosing a layout theme
For this example, you can leave the default layout theme.
Click
Finish.
If you need to make changes, you can click Back instead to return to specific wizard pages.
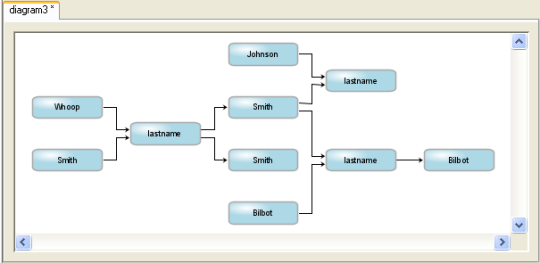
When you exit the wizard, your diagram is displayed in the Diagram pane, see the following figure.
The initial view of the genealogy diagram
You can now change the styling as required in Style Editing Mode.
Copyright © 2018, Rogue Wave Software, Inc. All Rights Reserved.